
Page 202 - Petrophysics 2E
P. 202
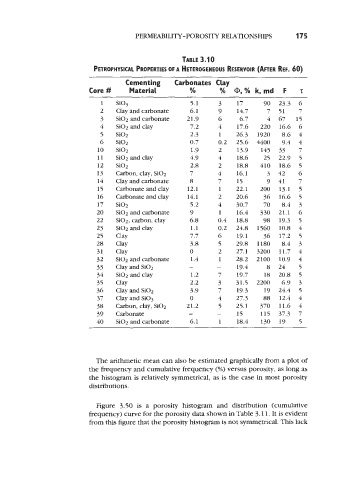
PERMEABILITY-POROSITY  RELATIONSHIPS             175


                                                        TABU 3.10
                              PETROPHYSICAL PROPERTIES OF A HETEROGENEOUS RESERVOIR (AFTER REF. 60)

                                         ~~
                                       Cementing      Carbonates  Clay
                            Core #      Material           %        %  @,%  k,md  F         ‘I:
                                1   Si03                   5.1      3    17      90  23.3  6
                               2    Clay and carbonate     6.1     9     14.7     7  51     7
                                3   Si02 and carbonate    21.9     6      6.7     4  67    15
                                4   Si02 and clay          7.2      4    17.6   220   16.6  6
                                5   Si02                   2.3      1    26.3  1920    8.6  4
                               6    Si02                   0.7     0.2   25.6  4400    9.4  4
                               10   Si02                   1.9      2    13.9   145  33     7
                               11   Si02 and clay          4.9     4     18.6    25  22.9  5
                               12   Si02                   2.8      2    18.8   410   18.6  5
                               13   Carbon, clay, Si02     7       4     16.1     3  42     6
                               14   Clay and carbonate     8        7    15       9  41     7
                               15   Carbonate and clay    12.1      1    22.1   200  13.1  5
                               16   Carbonate and clay    14.1      2    20.6    36  16.6  5
                               17   Si02                   5.2      4    30.7    70    8.4  3
                               20   Si02 and carbonate     9        1    16.4   330  21.1  6
                               22   Si02, carbon, clay     6.8      0.4   18.8   98  19.3  5
                               23   Si02 and clay          1.1      0.2   24.8   1560  10.8  4
                               25   Clay                   7.7      6    19.1    36   17.2  5
                               28   Clay                   3.8      5    29.8  1180    8.4  3
                               31   Clay                   0        2    27.1  3200  11.7  4
                               32   Si02 and carbonate     1.4      1    28.2   2100  10.9  4
                               33   Clay and Si02          -       -     19.4     8  24     5
                               34   Si02 and clay          1.2      7    19.7     18  20.8  5
                               35   Clay                   2.2      3    31.5  2200    6.9  3
                               36   Clay and Si02          3.9      7    19.3     19  24.4  5
                               37    Clay and Si03         0        4    27.3    88  12.4  4
                               38   Carbon, clay, Si02    21.2      5    25.1   370   11.6  4
                               39   Carbonate              -       -     15      115  37.3  7
                               40    Si02 and carbonate    6.1      1    18.4    130  19    5


                              The arithmetic mean can also be estimated graphically from a plot of
                            the frequency and cumulative frequency (%)  versus porosity, as long as
                            the histogram is relatively symmetrical, as is the case in most porosity
                            distributions.

                               Figure  3.50 is  a  porosity  histogram  and  distribution  (cumulative
                            frequency) curve for the porosity data shown in Table 3.1 1. It is evident
                            from this figure that the porosity histogram is not symmetrical. This lack