Page 203 - Petrophysics 2E
P. 203

176    PETROPHYSICS: RESERVOIR ROCK PROPERTIES


                              30                                           120

                              25
                          8
                           k  20
                           0
                           C
                              15
                           CT
                           2
                          LL   10

                               5

                               0
                                  -  10  12  14  16  18  20  22  24  26  28  30+
                                                  Porosity, YO

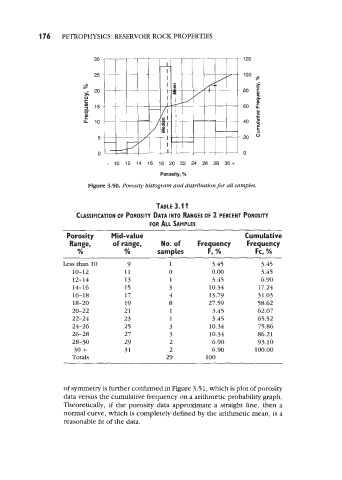
                            Figure 3.50.  Porosity histogram and distribution for all samples.

                                                TABLE 3.1 1
                        CLAsSlFlCAllON OF POROSITY DATA INTO RANGES OF 2 PERCENT POROSITY
                                              FOR ALL SAMPLES
                     Porosity      Mid-value                               Cumulative
                      Range,       of range,      No. of     Frequency      Frequency
                         %             %         samples        F, %           Fc, %

                    Less than 10        9           1            3.45           3.45
                       10-12           11           0            0.00           3.45
                       12-14           13            1           3.45           6.90
                       14-16           15           3            10.34         17.24
                       16-18           17           4            13.79         3 1.03
                       18-20           19           8           27.59          58.62
                       20-22           21            1            3.45         62.07
                       22-24           23            1            3.45         65.52
                       24-26           25           3            10.34         75.86
                       26-28           27           3            10.34         86.21
                       28-30           29           2            6.90          93.10
                       30 +            31           2            6.90          100.00
                       Totals                      29           100


                    of symmetry is further confirmed in Figure 3.5 1, which is plot of porosity
                    data versus the cumulative frequency on a arithmetic probability graph.
                    Theoretically, if the porosity data  approximate a straight line, then a
                    normal curve, which is completely defined by the arithmetic mean, is a
                    reasonable fit of the data.
   198   199   200   201   202   203   204   205   206   207   208