
Page 309 - Petrophysics 2E
P. 309
280 PETROPHYSICS: RESERVOIR ROCK PROPERTIES
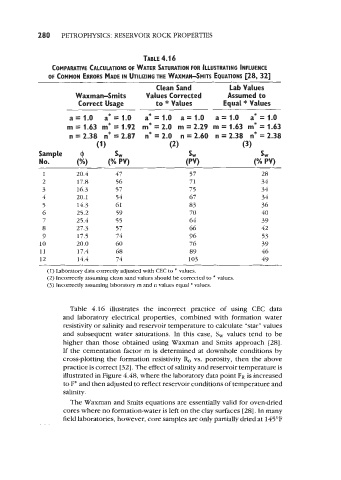
TABLE 4.16
COMPARATIVE CALCULATIONS OF WATER SATURATION FOR ILLUSTRATING INFLUENCE
OF COMMON ERRORS MADE IN UTILIZING THE WAXMAN-SMITS EQUATIONS [28, 321
Clean Sand Lab Values
Waxman-Smits Values Corrected Assumed to
Correct Usage to * Values Equal * Values
asi.0 a*=1.0 a*=1.0 a=1.0 a=1.0 a*=1.0
m = 1.63 m* = 1.92 my = 2.0 m = 2.29 m = 1.63 m* = 1.63
n = 2.38 n* = 2.87 n* = 2.0 n = 2.60 n = 2.38 n* = 2.38
(1) (2) (3)
Sample (I svv SW SW
No. (%I (% PV) (PV) (% PV)
1 20.4 47 57 28
2 17.8 56 71 34
3 16.3 57 75 34
4 20.1 54 67 34
5 14.3 61 83 36
6 25.2 59 70 40
7 25.4 55 64 39
8 27.3 57 66 42
9 17.5 74 96 53
10 20.0 60 76 39
11 17.4 68 89 46
12 14.4 74 103 49
(1) Laboratory data correctly adjusted with CEC to * values.
(2) Incorrectly assuming clean sand values should be corrected to * values.
(3) Incorrectly assuming laboratory m and n values equal * values.
Table 4.16 illustrates the incorrect practice of using CEC data
and laboratory electrical properties, combined with formation water
resistivity or salinity and reservoir temperature to calculate “star” values
and subsequent water saturations. In this case, S, values tend to be
higher than those obtained using Waxman and Smits approach [28].
If the cementation factor m is determined at downhole conditions by
cross-plotting the formation resistivity & vs. porosity, then the above
practice is correct [32]. The effect of salinity and reservoir temperature is
illustrated in Figure 4.48, where the laboratory data point FR is increased
to F* and then adjusted to reflect reservoir conditions of temperature and
salinity.
The Waxman and Smits equations are essentially valid for ovendried
cores where no formation-water is left on the clay surfaces [28]. In many
field laboratories, however, core samples are only partially dried at 145°F