
Page 304 - Petrophysics 2E
P. 304
LAB-DERIVED EVALUATION OF SHALY 275
intercept a* = 1. Thus, the formation resistivity factor for the
Shannon shaly sands can be represented by the following
expression:
1
F* = -
$1.92
Figure 4.44 also includes a plot of F versus $. The slope m of the
best-fit line m is 1.62 and the coefficient a is unity. It is evident from
this figure that the calculated F* values fit an average line more closely
than the measured F values, where conductivity of clays was not
accounted for.
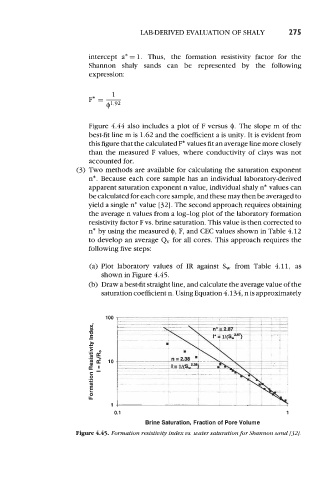
(3) Two methods are available for calculating the saturation exponent
n*. Because each core sample has an individual laboratoryderived
apparent saturation exponent n value, individual shaly n* values can
be calculated for each core sample, and these may then be averaged to
yield a single n* value [32]. The second approach requires obtaining
the average n values from a log-log plot of the laboratory formation
resistivity factor F vs. brine saturation. This value is then corrected to
n* by using the measured $, F, and CEC values shown in Table 4.12
to develop an average Qv for all cores. This approach requires the
following five steps:
(a) Plot laboratory values of IR against S, from Table 4.11, as
shown in Figure 4.45.
(b) Draw a best-fit straight line, and calculate the average value of the
saturation coefficient n. Using Equation 4.134, n is approximately
0.1 1
Brine Saturation, Fraction of Pore Volume
Figure 4.45. Formation resistivity index us. water saturation for Shannon sand [32].