
Page 307 - Petrophysics 2E
P. 307
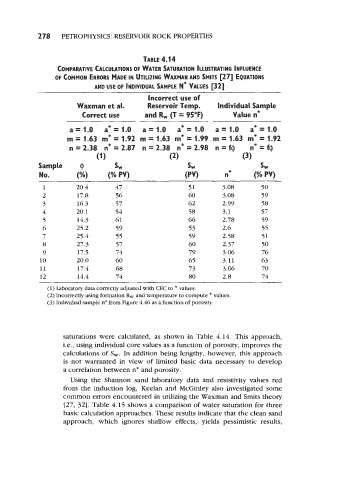
278    PETROPHYSICS: RESERVOIR ROCK PROPERTIES


                                             TABLE 4.14
                   COMPARATIVE CALCULATIONS OF WATER SATURATION ILLUSTRATING INFLUENCE
                  OF  COMMON ERRORS MADE IN UTILIZING WAXMAN AND SMlTS  [27]  EQUATIONS
                              AND USE OF  1NDlVlDUAL SAMPLE N* VALUES  1321
                                              Incorrect use of
                         Waxman et at.        Reservoir Temp.      Individual Sample
                          Correct use        and Rw (T  = 95°F)         Value n*

                      a= 1.0     a*= 1.0     a= 1.0    a*= 1.0     a= 1.0    a*= 1.0
                      m = 1.63  m* = 1.92  m = 1.63  m* = 1.99  m = 1.63  m* = 1.92
                      n = 2.30  n* = 2.07  n = 2.38  n* = 2.90  n = f$       n* = f@
                               (1)                   (2)                   (3)
             Sample      @          SW                    sw                    sw
             No.         (%)      (% PV)                 (PV)         n*      (% PV)
              1         20.4        47                     51        3.08        50
              2          17.8       56                    60         3.08        59
              3          16.3       57                    62         2.99        58
              4         20.1        54                     58        3.1         57
              5          14.3       61                     66        2.78        59
              6         25.2        59                     53        2.6         55
              7         25.4        55                     59        2.58        51
              8          27.3       57                     60        2.37        50
              9          17.5       74                     79        3.06        76
             10         20.0        60                     65        3.11        63
             11          17.4       68                     73        3.06        70
             12          14.4       74                     80        2.8         74
                (1) Laboratory data correctly adjusted with CEC to * values.
                (2) Incorrectly using formation Rw and temperature to compute * values.
               (3) Individual sample n* from Figure 4.46 as a function of porosity.


                    saturations were calculated, as shown in Table 4.14.  This approach,
                    i.e., using individual core values as a function of porosity, improves the
                    calculations of S,.   In addition being lengthy, however, this approach
                    is  not  warranted  in  view  of  limited basic  data  necessary to  develop
                    a correlation between n* and porosity.
                      Using  the  Shannon sand  laboratory data  and  resistivity values red
                    from the induction log,  Keelan and McGinley also investigated some
                    common errors encountered in utilizing the Waxman and Smits theory
                     [27, 321, Table 4.15 shows a comparison of water saturation for three
                    basic calculation approaches. These results indicate that the clean sand
                    approach,  which  ignores  shallow  effects,  yields  pessimistic  results,