
Page 148 - Phase Space Optics Fundamentals and Applications
P. 148
The Radon-Wigner Transform 129
, o (x , ), this single display can
and does not affect the function RW q
be used for the determination of the irradiance for different amounts
of SA. Thus, compared to classic techniques, the reduction in compu-
tation time is evident. The axial irradiance distribution is often used
as a figure of merit for the performance of optical systems with aberra-
tions. This distribution can be obtained here as a particular case with
= 0, namely,
1
I (0, 0,z) = 2 2 RW q 0,0 (x (z), ) (4.74)
( f + z)
where
q 0,0 (s) = Q 0,0 (r ) = Q 0 (r ) (4.75)
N N
This result is especially interesting since this mapped pupil, and thus
the associated RWT, is also independent of the wavelength . This fact
represents an additional advantage when a polychromatic assessment
of the imaging system is needed, as will be shown in forthcoming
sections. Some quantitative estimation of these improvements is pre-
sented in Ref. 19.
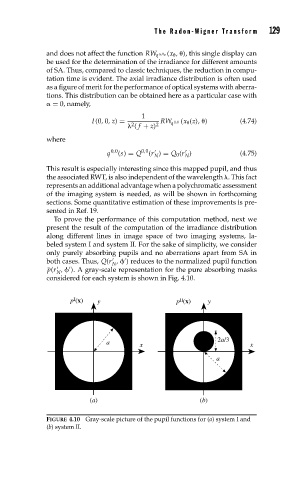
To prove the performance of this computation method, next we
present the result of the computation of the irradiance distribution
along different lines in image space of two imaging systems, la-
beled system I and system II. For the sake of simplicity, we consider
only purely absorbing pupils and no aberrations apart from SA in
both cases. Thus, Q(r , ) reduces to the normalized pupil function
N
¯ p(r , ). A gray-scale representation for the pure absorbing masks
N
considered for each system is shown in Fig. 4.10.
I
p (x) y p (x) y
II
2a/3
a x x
a
(a) (b)
FIGURE 4.10 Gray-scale picture of the pupil functions for (a) system I and
(b) system II.