
Page 231 - Phase Space Optics Fundamentals and Applications
P. 231
212 Chapter Six
ν
ν
ν
x
x
x
λ
(a)
ν
x
(b)
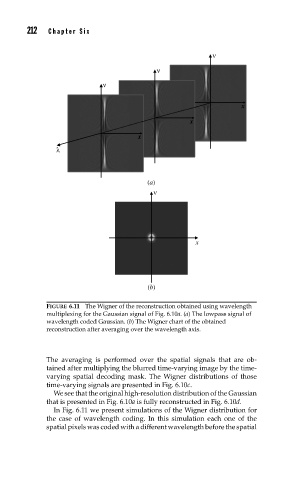
FIGURE 6.11 The Wigner of the reconstruction obtained using wavelength
multiplexing for the Gaussian signal of Fig. 6.10a.(a) The lowpass signal of
wavelength coded Gaussian. (b) The Wigner chart of the obtained
reconstruction after averaging over the wavelength axis.
The averaging is performed over the spatial signals that are ob-
tained after multiplying the blurred time-varying image by the time-
varying spatial decoding mask. The Wigner distributions of those
time-varying signals are presented in Fig. 6.10c.
We see that the original high-resolution distribution of the Gaussian
that is presented in Fig. 6.10a is fully reconstructed in Fig. 6.10d.
In Fig. 6.11 we present simulations of the Wigner distribution for
the case of wavelength coding. In this simulation each one of the
spatial pixels was coded with a different wavelength before the spatial