
Page 204 - Photodetection and Measurement - Maximizing Performance in Optical Systems
P. 204
Contamination and Industrial Systems
Contamination and Industrial Systems 197
0.9
0.8
0.7 l min Sample plus
Absorbance (1cm path) 0.5 l max
0.6
absorbing matrix
0.4
0.3
Sample in
0.2
nonabsorbing solvent
0.1
0.0
250 300 350 400 450 500 550 600 650
Wavelength (nm)
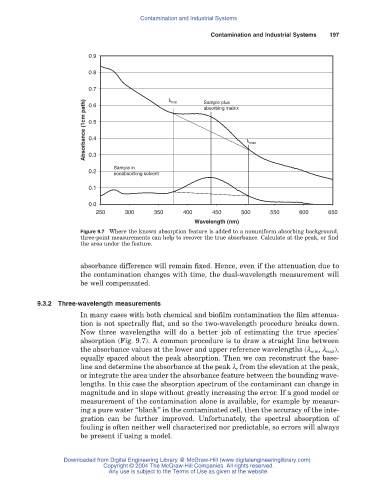
Figure 9.7 Where the known absorption feature is added to a nonuniform absorbing background,
three-point measurements can help to recover the true absorbance. Calculate at the peak, or find
the area under the feature.
absorbance difference will remain fixed. Hence, even if the attenuation due to
the contamination changes with time, the dual-wavelength measurement will
be well compensated.
9.3.2 Three-wavelength measurements
In many cases with both chemical and biofilm contamination the film attenua-
tion is not spectrally flat, and so the two-wavelength procedure breaks down.
Now three wavelengths will do a better job of estimating the true species’
absorption (Fig. 9.7). A common procedure is to draw a straight line between
the absorbance values at the lower and upper reference wavelengths (l min, l max),
equally spaced about the peak absorption. Then we can reconstruct the base-
line and determine the absorbance at the peak l c from the elevation at the peak,
or integrate the area under the absorbance feature between the bounding wave-
lengths. In this case the absorption spectrum of the contaminant can change in
magnitude and in slope without greatly increasing the error. If a good model or
measurement of the contamination alone is available, for example by measur-
ing a pure water “blank” in the contaminated cell, then the accuracy of the inte-
gration can be further improved. Unfortunately, the spectral absorption of
fouling is often neither well characterized nor predictable, so errors will always
be present if using a model.
Downloaded from Digital Engineering Library @ McGraw-Hill (www.digitalengineeringlibrary.com)
Copyright © 2004 The McGraw-Hill Companies. All rights reserved.
Any use is subject to the Terms of Use as given at the website.