
Page 202 - Photodetection and Measurement - Maximizing Performance in Optical Systems
P. 202
Contamination and Industrial Systems
Contamination and Industrial Systems 195
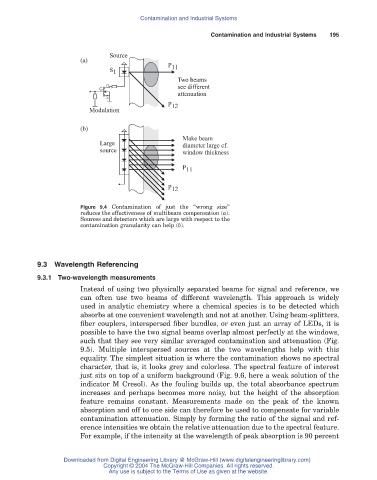
Source
(a)
P 11
S 1
Two beams
D
G see different
attenuation
S
P 12
Modulation
(b)
Make beam
Large diameter large cf.
source window thickness
P 11
P 12
Figure 9.4 Contamination of just the “wrong size”
reduces the effectiveness of multibeam compensation (a).
Sources and detectors which are large with respect to the
contamination granularity can help (b).
9.3 Wavelength Referencing
9.3.1 Two-wavelength measurements
Instead of using two physically separated beams for signal and reference, we
can often use two beams of different wavelength. This approach is widely
used in analytic chemistry where a chemical species is to be detected which
absorbs at one convenient wavelength and not at another. Using beam-splitters,
fiber couplers, interspersed fiber bundles, or even just an array of LEDs, it is
possible to have the two signal beams overlap almost perfectly at the windows,
such that they see very similar averaged contamination and attenuation (Fig.
9.5). Multiple interspersed sources at the two wavelengths help with this
equality. The simplest situation is where the contamination shows no spectral
character, that is, it looks grey and colorless. The spectral feature of interest
just sits on top of a uniform background (Fig. 9.6, here a weak solution of the
indicator M Cresol). As the fouling builds up, the total absorbance spectrum
increases and perhaps becomes more noisy, but the height of the absorption
feature remains constant. Measurements made on the peak of the known
absorption and off to one side can therefore be used to compensate for variable
contamination attenuation. Simply by forming the ratio of the signal and ref-
erence intensities we obtain the relative attenuation due to the spectral feature.
For example, if the intensity at the wavelength of peak absorption is 90 percent
Downloaded from Digital Engineering Library @ McGraw-Hill (www.digitalengineeringlibrary.com)
Copyright © 2004 The McGraw-Hill Companies. All rights reserved.
Any use is subject to the Terms of Use as given at the website.