Page 232 - Photodetection and Measurement - Maximizing Performance in Optical Systems
P. 232

Measurand Modulation

                                                                        Measurand Modulation  225

                                                           Tungsten point
                                                           electrode
                                 0-6kV    4 x1M Resistors
                        HT PSU
                                                                     Corona wind
                                                                 e
                                                                      e
                                                                        Dimpled
                                                                        water surface
                                             Sample
                                                             To diode array
                                                             spectrometer:
                          Deuterium  Silica                               Decreasing
                          lamp       cuvette     Ground                   absorption
                                                              Absorbance
                                                 wire


                                                                       Wavelength
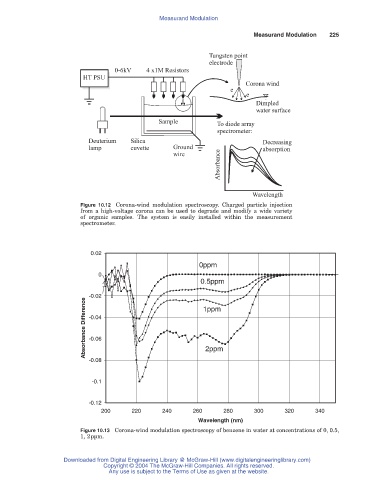
                       Figure 10.12 Corona-wind modulation spectroscopy. Charged particle injection
                       from a high-voltage corona can be used to degrade and modify a wide variety
                       of organic samples. The system is easily installed within the measurement
                       spectrometer.


                          0.02
                                                        0ppm
                            0
                                                         0.5ppm

                          -0.02                           1ppm
                         Absorbance Difference  -0.04


                          -0.06


                          -0.08                           2ppm


                           -0.1


                          -0.12
                             200      220     240      260     280      300     320      340
                                                        Wavelength (nm)
                       Figure 10.13 Corona-wind modulation spectroscopy of benzene in water at concentrations of 0, 0.5,
                       1, 2ppm.


                   Downloaded from Digital Engineering Library @ McGraw-Hill (www.digitalengineeringlibrary.com)
                              Copyright © 2004 The McGraw-Hill Companies. All rights reserved.
                               Any use is subject to the Terms of Use as given at the website.
   227   228   229   230   231   232   233   234   235   236   237