
Page 250 - Physical Principles of Sedimentary Basin Analysis
P. 250
232 Subsidence
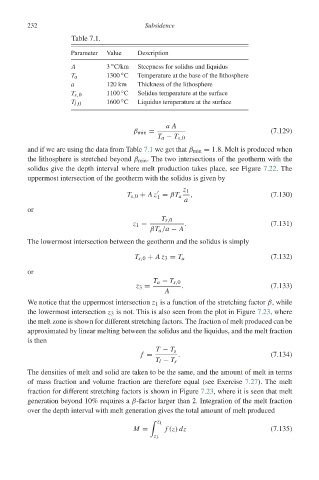
Table 7.1.
Parameter Value Description
◦
A 3 C/km Steepness for solidus and liquidus
◦
T a 1300 C Temperature at the base of the lithosphere
a 120 km Thickness of the lithosphere
◦
T s,0 1100 C Solidus temperature at the surface
◦
T l,0 1600 C Liquidus temperature at the surface
aA
β min = (7.129)
T a − T s,0
and if we are using the data from Table 7.1 we get that β min = 1.8. Melt is produced when
the lithosphere is stretched beyond β min . The two intersections of the geotherm with the
solidus give the depth interval where melt production takes place, see Figure 7.22.The
uppermost intersection of the geotherm with the solidus is given by
z 1
T s,0 + Az = βT a , (7.130)
1
a
or
T s,0
z 1 = . (7.131)
βT a /a − A
The lowermost intersection between the geotherm and the solidus is simply
T s,0 + Az 3 = T a (7.132)
or
T a − T s,0
z 3 = . (7.133)
A
We notice that the uppermost intersection z 1 is a function of the stretching factor β, while
the lowermost intersection z 3 is not. This is also seen from the plot in Figure 7.23, where
the melt zone is shown for different stretching factors. The fraction of melt produced can be
approximated by linear melting between the solidus and the liquidus, and the melt fraction
is then
T − T s
f = . (7.134)
T l − T s
The densities of melt and solid are taken to be the same, and the amount of melt in terms
of mass fraction and volume fraction are therefore equal (see Exercise 7.27). The melt
fraction for different stretching factors is shown in Figure 7.23, where it is seen that melt
generation beyond 10% requires a β-factor larger than 2. Integration of the melt fraction
over the depth interval with melt generation gives the total amount of melt produced
z 1
M = f (z) dz (7.135)
z 3