
Page 294 - Physical Principles of Sedimentary Basin Analysis
P. 294
276 Rheology: fracture and flow
0 0
a (a) (b)
20 b c brittle−ductile 20
d transition
a b
40 40 c d
a b
depth [km] 60 c d depth [km] 60
80 80
100 100
120 120
0 500 1000 1500 0 500 1000 1500
σ 1 − σ 3 [MPa] temperature [C]
0 0
a a
b (c) b (d)
20 c 20
d
c
40 40 d
a b
depth [km] 60 c d depth [km] 60
80 80
100
100
120 120
0 500 1000 1500 0 500 1000 1500
σ 1 − σ 3 [MPa] σ 1 − σ 3 [MPa]
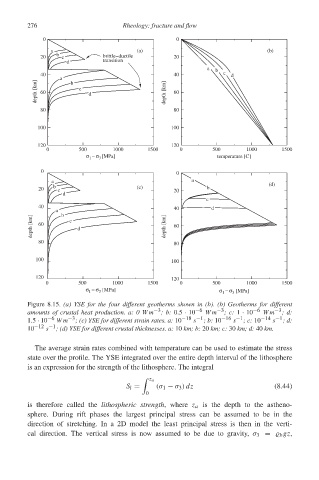
Figure 8.15. (a) YSE for the four different geotherms shown in (b). (b) Geotherms for different
amounts of crustal heat production. a: 0 W m −3 ;b: 0.5 · 10 −6 Wm −3 ;c: 1 · 10 −6 Wm −3 ;d:
1.5 · 10 −6 Wm −3 ; (c) YSE for different strain rates. a: 10 −18 −1 ;b: 10 −16 −1 ;c: 10 −14 −1 ;d:
s
s
s
s
10 −12 −1 ; (d) YSE for different crustal thicknesses. a: 10 km; b: 20 km; c: 30 km; d: 40 km.
The average strain rates combined with temperature can be used to estimate the stress
state over the profile. The YSE integrated over the entire depth interval of the lithosphere
is an expression for the strength of the lithosphere. The integral
z a
S l = (σ 1 − σ 3 ) dz (8.44)
0
is therefore called the lithospheric strength, where z a is the depth to the astheno-
sphere. During rift phases the largest principal stress can be assumed to be in the
direction of stretching. In a 2D model the least principal stress is then in the verti-
cal direction. The vertical stress is now assumed to be due to gravity, σ 3 = b gz,