
Page 293 - Physical Principles of Sedimentary Basin Analysis
P. 293
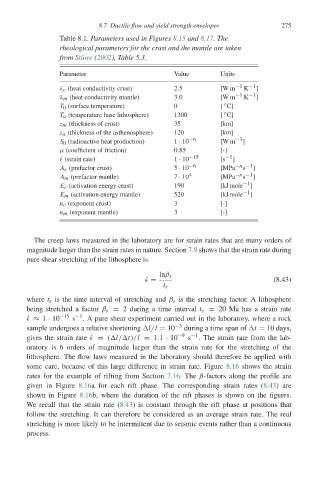
8.7 Ductile flow and yield strength envelopes      275
                     Table 8.1. Parameters used in Figures 8.15 and 8.17. The
                     rheological parameters for the crust and the mantle are taken
                     from Stüwe (2002), Table 5.3.

                     Parameter                      Value       Units
                     λ c (heat conductivity crust)  2.5         [W m −1  K −1 ]
                     λ m (heat conductivity mantle)  3.0        [W m −1  K −1 ]
                                                                 ◦
                     T 0 (surface temperature)      0           [ C]
                                                                 ◦
                     T a (temperature base lithosphere)  1300   [ C]
                     z m (thickness of crust)       35          [km]
                     z a (thickness of the asthenosphere)  120  [km]
                     S 0 (radioactive heat production)  1 · 10 −6  [W m −3 ]
                     μ (coefficient of friction)     0.85        [-]
                     ˙   (strain rate)              1 · 10 −15  [s −1 ]
                     A c (prefactor crust)          5 · 10 −6   [MPa −n −1 ]
                                                                      s
                                                                      s
                     A m (prefactor mantle)         7 · 10 4    [MPa −n −1 ]
                     E c (activation energy crust)  190         [kJ mole −1 ]
                     E m (activation energy mantle)  520        [kJ mole −1 ]
                     n c (exponent crust)           3           [-]
                     n m (exponent mantle)          3           [-]


              The creep laws measured in the laboratory are for strain rates that are many orders of
            magnitude larger than the strain rates in nature. Section 7.9 shows that the strain rate during
            pure shear stretching of the lithosphere is

                                                lnβ s
                                            ˙   =                              (8.43)
                                                 t s
            where t s is the time interval of stretching and β s is the stretching factor. A lithosphere
            being stretched a factor β s = 2 during a time interval t s = 20 Ma has a strain rate
            ˙   ≈ 1 · 10 −15  s −1 . A pure shear experiment carried out in the laboratory, where a rock
            sample undergoes a relative shortening  l/l = 10 −3  during a time span of  t = 10 days,
            gives the strain rate ˙  = ( l/ t)/l = 1.1 · 10 −9  s −1 . The strain rate from the lab-
            oratory is 6 orders of magnitude larger than the strain rate for the stretching of the
            lithosphere. The flow laws measured in the laboratory should therefore be applied with
            some care, because of this large difference in strain rate. Figure 8.16 shows the strain
            rates for the example of rifting from Section 7.16.The β-factors along the profile are
            given in Figure 8.16a for each rift phase. The corresponding strain rates (8.43)are
            shown in Figure 8.16b, where the duration of the rift phases is shown on the figures.
            We recall that the strain rate (8.43) is constant through the rift phase at positions that
            follow the stretching. It can therefore be considered as an average strain rate. The real
            stretching is more likely to be intermittent due to seismic events rather than a continuous
            process.