
Page 296 - Physical Principles of Sedimentary Basin Analysis
P. 296
278 Rheology: fracture and flow
4×10 7 7 5×10 7 7
lithospheric strength [MPa m] 3×10 7 7 lithospheric strength [MPa m] 3×10 7 7
4×10
2×10
2×10
1×10
0×10 7 1×10 7 7
0×10
0.0 0.5 1.0 1.5 2.0 2.5 10 20 30 40 50
radioactive heat production [μW/m ] 3 crustal thickness [km]
(a) (b)
4×10 7 7
lithospheric strength [MPa m] 3×10 7 7
2×10
1×10
0×10 7
−18 −16 −14 −12 −10
log10(ε) [1/s]
(c)
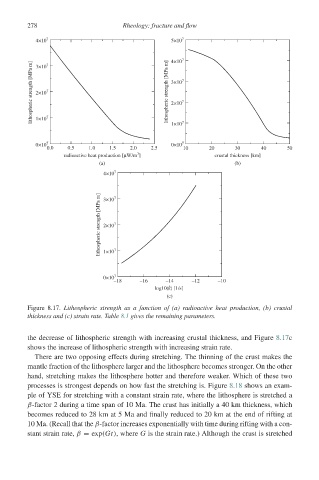
Figure 8.17. Lithospheric strength as a function of (a) radioactive heat production, (b) crustal
thickness and (c) strain rate. Table 8.1 gives the remaining parameters.
the decrease of lithospheric strength with increasing crustal thickness, and Figure 8.17c
shows the increase of lithospheric strength with increasing strain rate.
There are two opposing effects during stretching. The thinning of the crust makes the
mantle fraction of the lithosphere larger and the lithosphere becomes stronger. On the other
hand, stretching makes the lithosphere hotter and therefore weaker. Which of these two
processes is strongest depends on how fast the stretching is. Figure 8.18 shows an exam-
ple of YSE for stretching with a constant strain rate, where the lithosphere is stretched a
β-factor 2 during a time span of 10 Ma. The crust has initially a 40 km thickness, which
becomes reduced to 28 km at 5 Ma and finally reduced to 20 km at the end of rifting at
10 Ma. (Recall that the β-factor increases exponentially with time during rifting with a con-
stant strain rate, β = exp(Gt), where G is the strain rate.) Although the crust is stretched