
Page 297 - Physical Principles of Sedimentary Basin Analysis
P. 297
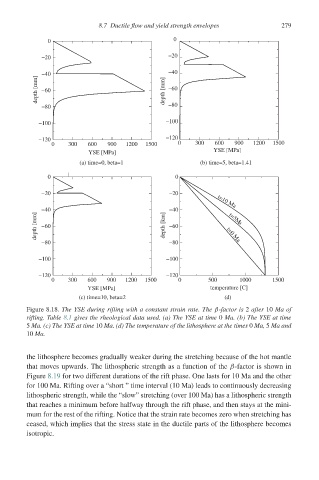
8.7 Ductile flow and yield strength envelopes      279

                  0                                 0

                −20                               −20
                                                  −40
               depth [mm] −40                    depth [mm]   −60
                −60

                −80                               −80

               −100                               −100

               −120                               −120
                   0   300  600   900  1200  1500    0    300  600  900  1200  1500
                             YSE [MPa]                        YSE [MPa]
                          (a) time=0, beta=1               (b) time=5, beta=1.41

                  0                                 0

                −20                               −20           t=10 Ma
              depth [mm] −40                     depth [km] −40    t=5  Ma

                                                  −60
                −60
                −80                               −80             t=0 Ma

               −100                               −100

               −120                               −120
                   0   300  600   900  1200  1500    0       500      1000    1500
                            YSE [MPa]                         temperature [C]
                          (c) time=10, beta=2                    (d)
            Figure 8.18. The YSE during rifting with a constant strain rate. The β-factor is 2 after 10 Ma of
            rifting. Table 8.1 gives the rheological data used. (a) The YSE at time 0 Ma. (b) The YSE at time
            5 Ma. (c) The YSE at time 10 Ma. (d) The temperature of the lithosphere at the times 0 Ma, 5 Ma and
            10 Ma.


            the lithosphere becomes gradually weaker during the stretching because of the hot mantle
            that moves upwards. The lithospheric strength as a function of the β-factor is shown in
            Figure 8.19 for two different durations of the rift phase. One lasts for 10 Ma and the other
            for 100 Ma. Rifting over a “short ” time interval (10 Ma) leads to continuously decreasing
            lithospheric strength, while the “slow” stretching (over 100 Ma) has a lithospheric strength
            that reaches a minimum before halfway through the rift phase, and then stays at the mini-
            mum for the rest of the rifting. Notice that the strain rate becomes zero when stretching has
            ceased, which implies that the stress state in the ductile parts of the lithosphere becomes
            isotropic.