
Page 193 - Physical chemistry understanding our chemical world
P. 193
160 REACTION SPONTANEITY AND THE DIRECTION OF THERMODYNAMIC CHANGE
when the battery is ‘dead’, i.e. the reaction has reached its equilib-
The relationship be-
rium extent of reaction ξ (eq) .
tween G and volt-
age is discussed in The battery voltage is proportional to the change in the Gibbs
Section 7.1. function associated with the battery reaction, call it G (battery) .
Therefore, we deduce that G (battery) must decrease to zero because
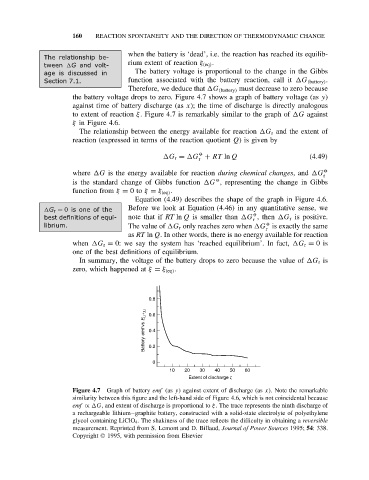
the battery voltage drops to zero. Figure 4.7 shows a graph of battery voltage (as y)
against time of battery discharge (as x); the time of discharge is directly analogous
to extent of reaction ξ. Figure 4.7 is remarkably similar to the graph of G against
ξ in Figure 4.6.
The relationship between the energy available for reaction G r and the extent of
reaction (expressed in terms of the reaction quotient Q) is given by
O
G r = G + RT ln Q (4.49)
r
where G is the energy available for reaction during chemical changes, and G O
r
O
is the standard change of Gibbs function G , representing the change in Gibbs
function from ξ = 0to ξ = ξ (eq) .
Equation (4.49) describes the shape of the graph in Figure 4.6.
G r = 0is oneof the Before we look at Equation (4.46) in any quantitative sense, we
O
best definitions of equi- note that if RT ln Q is smaller than G , then G r is positive.
r
librium. The value of G r only reaches zero when G is exactly the same
O
r
as RT ln Q. In other words, there is no energy available for reaction
when G r = 0: we say the system has ‘reached equilibrium’. In fact, G r = 0is
one of the best definitions of equilibrium.
In summary, the voltage of the battery drops to zero because the value of G r is
zero, which happened at ξ = ξ (eq) .
0.8
Battery emf vs E Li + ,Li 0.4
0.6
0.2
0
10 20 30 40 50 60
Extent of discharge z
Figure 4.7 Graph of battery emf (as y) against extent of discharge (as x). Note the remarkable
similarity between this figure and the left-hand side of Figure 4.6, which is not coincidental because
emf ∝ G, and extent of discharge is proportional to ξ. The trace represents the ninth discharge of
a rechargeable lithium–graphite battery, constructed with a solid-state electrolyte of polyethylene
glycol containing LiClO 4 . The shakiness of the trace reflects the difficulty in obtaining a reversible
measurement. Reprinted from S. Lemont and D. Billaud, Journal of Power Sources 1995; 54: 338.
Copyright 1995, with permission from Elsevier