
Page 102 - Physical chemistry eng
P. 102
4.6 DIFFERENTIAL SCANNING CALORIMETRY 79
The corresponding equation for the reference in which only heating occurs is
dT (t)
R
C =£ ER (t) (4.29)
R
dt
The essence of DSC is that a difference between the heat flux to the sample and reference
is measured. We therefore subtract Equation (4.29) from Equation (4.28) and obtain
dT (t) d¢T(t)
R
£ (t) -£ ER (t) = (C - C ) + C +£(t) (4.30)
R
ES
S
S
dt dt
The quantities £ ES and £ ER are directly proportional to the temperature differences
T - T S and T - T R and are inversely proportional to the thermal resistance R thermal
E
E
between the heated enclosure and the sample and reference. The latter are equal because
of the symmetry of the calorimeter. The thermal resistance R thermal is an intrinsic prop-
erty of the calorimeter and can be obtained through calibration of the instrument.
T - T S T - T R
E
E
£ ES = and £ ER = (4.31)
R thermal R thermal
Therefore,
H
¢T(t) dT (t) d¢T(t)
R
£(t) =- - (C - C ) - C (4.32)
S
R
S
R thermal dt dt
Equation (4.32) links the heat flow per unit mass generated by the process of interest, (a) T true
¢
£(t) , to the measured quantity T(t). Typically T is increased linearly with time,
R
T (t) = T + at
0
R
and Equation (4.32) simplifies to
C P
¢T(t) d¢T(t)
£(t) =- - a(C - C ) - C (4.33)
R
S
S
R thermal dt
We see that ¢T(t) is not simply related to £(t) , which is to be determined in the (b) T true
experiment. The second term in Equation (4.33) arises because the heat capacities of
the sample and reference are not equal. Additionally, the heat capacity of the sample
changes as it undergoes a phase change.
The third term in Equation (4.33) is proportional to d¢T(t)>dt and has the effect of apparent
broadening ¢T(t) relative to £(t) and shifting it to longer times. A schematic picture or C P
of a DSC scan in this model is shown in Figure 4.6.
Because C a =£ ER (t) from Equation (4.29) and T are proportional as shown in f
¢
R
Equation (4.31), a graph of C versus time has the same shape as shown in Figure 4.6. (c) T measured
R
An analogous equation can be written for the sample, so that
£ ES -£ ER = a(C - C )
R
S
Therefore, a graph of (C - C ) versus time also has the same shape as Figure 4.6. apparent
S
R
The goal of the experiment is to determine the heat absorbed or evolved in the or C P
process per unit mass, which is given by
f
t 2
q =¢H = £(t)dt (d) T measured
P
t
L 1
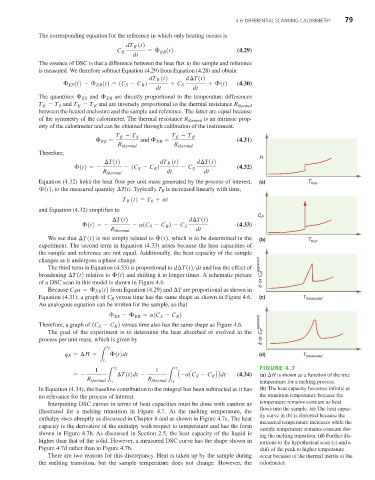
1 t 2 1 t 2 FIGURE 4.7
=- ¢T(t)dt - A -aAC - C BBdt (4.34) (a) ¢ H is shown as a function of the true
S
R
R t R t
thermal L 1 thermal L 1 temperature for a melting process.
In Equation (4.34), the baseline contribution to the integral has been subtracted as it has (b) The heat capacity becomes infinite at
no relevance for the process of interest. the transition temperature because the
Interpreting DSC curves in terms of heat capacities must be done with caution as temperature remains constant as heat
flows into the sample. (c) The heat capac-
illustrated for a melting transition in Figure 4.7. At the melting temperature, the
ity curve in (b) is distorted because the
enthalpy rises abruptly as discussed in Chapter 8 and as shown in Figure 4.7a. The heat
measured temperature increases while the
capacity is the derivative of the enthalpy with respect to temperature and has the form
sample temperature remains constant dur-
shown in Figure 4.7b. As discussed in Section 2.5, the heat capacity of the liquid is
ing the melting transition. (d) Further dis-
higher than that of the solid. However, a measured DSC curve has the shape shown in tortions to the hypothetical scan (c) and a
Figure 4.7d rather than in Figure 4.7b. shift of the peak to higher temperature
There are two reasons for this discrepancy. Heat is taken up by the sample during occur because of the thermal inertia of the
the melting transition, but the sample temperature does not change. However, the calorimeter.