
Page 101 - Physical chemistry eng
P. 101
78 CHAPTER 4 Thermochemistry
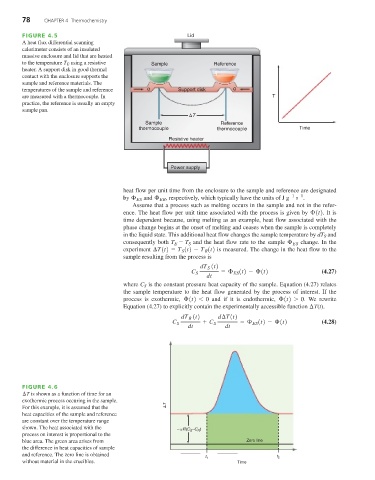
FIGURE 4.5 Lid
A heat flux differential scanning
calorimeter consists of an insulated
massive enclosure and lid that are heated
to the temperature T E using a resistive Sample Reference
heater. A support disk in good thermal
contact with the enclosure supports the
sample and reference materials. The
temperatures of the sample and reference q Support disk q
are measured with a thermocouple. In T
practice, the reference is usually an empty
sample pan.
T
Sample Reference
thermocouple thermocouple Time
Resistive heater
Power supply
heat flow per unit time from the enclosure to the sample and reference are designated
by £ ES and £ ER , respectively, which typically have the units of J g -1 -1
s .
Assume that a process such as melting occurs in the sample and not in the refer-
ence. The heat flow per unit time associated with the process is given by £(t) . It is
time dependent because, using melting as an example, heat flow associated with the
phase change begins at the onset of melting and ceases when the sample is completely
in the liquid state. This additional heat flow changes the sample temperature by dT and
S
consequently both T - T and the heat flow rate to the sample £ ES change. In the
S
E
experiment ¢T(t) = T (t) - T (t) is measured. The change in the heat flow to the
S
R
sample resulting from the process is
dT (t)
S
C =£ (t) -£(t) (4.27)
ES
S
dt
where C is the constant pressure heat capacity of the sample. Equation (4.27) relates
S
the sample temperature to the heat flow generated by the process of interest. If the
process is exothermic, £(t) 6 0 and if it is endothermic, £(t) 7 0 . We rewrite
¢
Equation (4.27) to explicitly contain the experimentally accessible function T(t).
(t) d¢T(t)
dT R
C + C =£ (t) -£(t) (4.28)
ES
S
S
dt dt
FIGURE 4.6
¢ T is shown as a function of time for an
exothermic process occuring in the sample.
For this example, it is assumed that the T
heat capacities of the sample and reference
are constant over the temperature range
shown. The heat associated with the R(C S –C R )
process on interest is proportional to the
blue area. The green area arises from Zero line
the difference in heat capacities of sample
and reference. The zero line is obtained
t 1 t 2
without material in the crucibles. Time