
Page 103 - Physical chemistry eng
P. 103
80 CHAPTER 4 Thermochemistry
sample crucible temperature continues to increase as heat flows to the sample.
Therefore the apparent heat capacity would have the shape shown in Figure 4.7c if
there were no resistances to heat flow in the calorimeter. The thermal resistances pres-
ent in the calorimeter smear out the curve shown in Figure 4.7c and shift it to higher
temperatures as shown in Figure 4.7d. Clearly, the temperature dependence of the
apparent heat capacity obtained directly from a DSC scan is significantly different from
the temperature dependence of the true heat capacity. Deconvolution procedures must
C P (T) be undertaken to obtain accurate heat capacities. Because the heat absorbed or evolved
in the process per unit mass is proportional to the area under the DSC scan, it is less
affected by the instrument distortions than the heat capacity.
C trs C P D DSC is the most direct method for determining the energetics of biological macromol-
P C
P
ecules undergoing conformational transitions, which is important in understanding their
biological activity. In particular, DSC has been used to determine the temperature range
C P den over which proteins undergo the conformational changes associated with reversible
C N
P int
C denaturation, a process in which a protein unfolds. The considerations for a melting
P
process discussed earlier apply as well as for denaturation, although melting enthalpies are
T 1 T M T 2 generally much larger than denaturation enthalpies. From the preceding discussion, when
a protein solution is heated at a constant rate and at constant pressure, DSC reports the
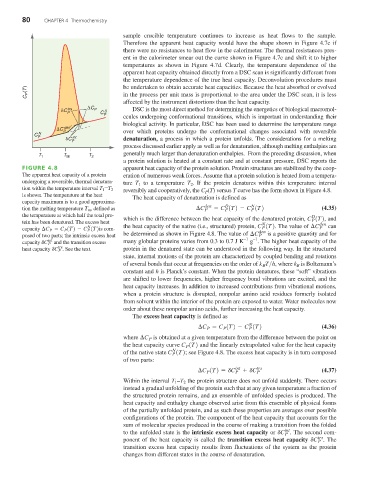
FIGURE 4.8 apparent heat capacity of the protein solution. Protein structures are stabilized by the coop-
The apparent heat capacity of a protein eration of numerous weak forces. Assume that a protein solution is heated from a tempera-
undergoing a reversible, thermal denatura- ture T to a temperature T . If the protein denatures within this temperature interval
2
1
reversibly and cooperatively, the C (T) versus T curve has the form shown in Figure 4.8.
tion within the temperature interval T 1 -T 2
P
is shown. The temperature at the heat The heat capacity of denaturation is defined as
capacity maximum is to a good approxima-
D
N
tion the melting temperature T m , defined as ¢C den = C (T) - C (T) (4.35)
P
P
P
the temperature at which half the total pro- which is the difference between the heat capacity of the denatured protein, C (T) , and
D
tein has been denatured. The excess heat N P den
N
P
capacity ¢C P = C P (T) - C P (T) is com- the heat capacity of the native (i.e., structured) protein, C (T) . The value of ¢C P can
den
posed of two parts; the intrinsic excess heat be determined as shown in Figure 4.8. The value of ¢C P is a positive quantity and for
–1
int many globular proteins varies from 0.3 to 0.7 J K –1 g . The higher heat capacity of the
capacity dC P and the transition excess
trs
heat capacity dC P . See the text. protein in the denatured state can be understood in the following way. In the structured
state, internal motions of the protein are characterized by coupled bending and rotations
of several bonds that occur at frequencies on the order of k T>h , where k is Boltzmann’s
B
B
constant and h is Planck’s constant. When the protein denatures, these “soft” vibrations
are shifted to lower frequencies, higher frequency bond vibrations are excited, and the
heat capacity increases. In addition to increased contributions from vibrational motions,
when a protein structure is disrupted, nonpolar amino acid residues formerly isolated
from solvent within the interior of the protein are exposed to water. Water molecules now
order about these nonpolar amino acids, further increasing the heat capacity.
The excess heat capacity is defined as
N
¢C = C (T) - C (T) (4.36)
P
P
P
where ¢C P is obtained at a given temperature from the difference between the point on
the heat capacity curve C (T) and the linearly extrapolated value for the heat capacity
P
N
of the native state C (T) ; see Figure 4.8. The excess heat capacity is in turn composed
P
of two parts:
¢C (T) = dC int + dC trs (4.37)
P
P
P
Within the interval T –T the protein structure does not unfold suddenly. There occurs
2
1
instead a gradual unfolding of the protein such that at any given temperature a fraction of
the structured protein remains, and an ensemble of unfolded species is produced. The
heat capacity and enthalpy change observed arise from this ensemble of physical forms
of the partially unfolded protein, and as such these properties are averages over possible
configurations of the protein. The component of the heat capacity that accounts for the
sum of molecular species produced in the course of making a transition from the folded
to the unfolded state is the intrinsic excess heat capacity or dC int . The second com-
P
ponent of the heat capacity is called the transition excess heat capacity dC trs . The
P
transition excess heat capacity results from fluctuations of the system as the protein
changes from different states in the course of denaturation.