Page 274 - Physical Chemistry
P. 274

lev38627_ch08.qxd  3/14/08  12:54 PM  Page 255


                                                                                                                 255
                  ( P/ T)   a/k [Eq. (1.45)]. Experiment shows ( P/ T) is finite and positive at the          Section 8.7
                         V m                                      V m
                                                                                      2
                  critical point. Therefore, a   q at the critical point. We have C P,m    C V,m    TV a /k    The Law of Corresponding States
                                                                                    m
                  C V,m    TV a( P/ T) V m  [Eq. (4.53)]. Since a   q at the critical point, it follows that
                            m
                  C P,m    q at the critical point. Figure 8.7 plots c for saturated liquid water and for satu-
                                                          P
                  rated water vapor versus T. (Recall Fig. 7.2, which plots r of each of the saturated
                  phases.) As the critical point (374°C, 218 atm) is approached, C P,m  of each phase goes to
                  infinity. For points close to the critical point, C P,m  is quite large. This explains the large
                  maxima in c of H O(g)on the 400°C isotherm and the 300-bar isobar in Fig. 2.5.
                                  2
                             P
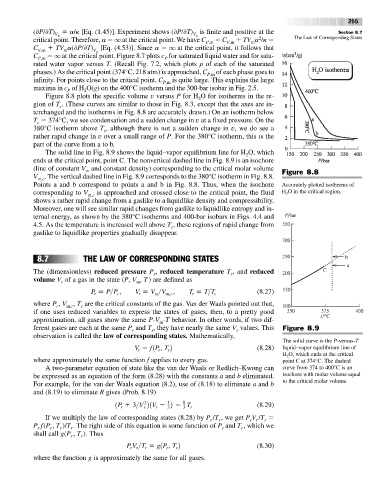
                      Figure 8.8 plots the specific volume v versus P for H O for isotherms in the re-
                                                                    2
                  gion of T . (These curves are similar to those in Fig. 8.3, except that the axes are in-
                          c
                  terchanged and the isotherms in Fig. 8.8 are accurately drawn.) On an isotherm below
                  T   374°C, we see condensation and a sudden change in v at a fixed pressure. On the
                    c
                  380°C isotherm above T , although there is not a sudden change in v, we do see a
                                        c
                  rather rapid change in v over a small range of P. For the 380°C isotherm, this is the
                  part of the curve from a to b.
                      The solid line in Fig. 8.9 shows the liquid–vapor equilibrium line for H O, which
                                                                                  2
                  ends at the critical point, point C. The nonvertical dashed line in Fig. 8.9 is an isochore
                  (line of constant V and constant density) corresponding to the critical molar volume  Figure 8.8
                                  m
                  V . The vertical dashed line in Fig. 8.9 corresponds to the 380°C isotherm in Fig. 8.8.
                    m,c
                  Points a and b correspond to points a and b in Fig. 8.8. Thus, when the isochore  Accurately plotted isotherms of
                  corresponding to V m,c  is approached and crossed close to the critical point, the fluid  H O in the critical region.
                                                                                              2
                  shows a rather rapid change from a gaslike to a liquidlike density and compressibility.
                  Moreover, one will see similar rapid changes from gaslike to liquidlike entropy and in-
                  ternal energy, as shown by the 380°C isotherms and 400-bar isobars in Figs. 4.4 and
                  4.5. As the temperature is increased well above T , these regions of rapid change from
                                                            c
                  gaslike to liquidlike properties gradually disappear.
                    8.7          THE LAW OF CORRESPONDING STATES

                  The (dimensionless) reduced pressure P , reduced temperature T , and reduced
                                                                             r
                                                      r
                  volume V of a gas in the state (P, V , T) are defined as
                           r
                                                 m
                                    P   P>P ,   V   V >V  m,c ,   T   T>T c          (8.27)
                                                                  r
                                                       m
                                                  r
                                           c
                                     r
                  where P , V , T are the critical constants of the gas. Van der Waals pointed out that,
                         c
                            m,c
                                 c
                  if one uses reduced variables to express the states of gases, then, to a pretty good
                  approximation, all gases show the same P-V -T behavior. In other words, if two dif-
                                                        m
                  ferent gases are each at the same P and T , they have nearly the same V values. This  Figure 8.9
                                                                               r
                                                      r
                                                r
                  observation is called the law of corresponding states. Mathematically,
                                                                                             The solid curve is the P-versus-T
                                                 V   f1P , T 2                       (8.28)  liquid–vapor equilibrium line of
                                                        r
                                                           r
                                                  r
                                                                                             H O, which ends at the critical
                                                                                              2
                  where approximately the same function f applies to every gas.              point C at 374°C. The dashed
                      A two-parameter equation of state like the van der Waals or Redlich–Kwong can  curve from 374 to 400°C is an
                  be expressed as an equation of the form (8.28) with the constants a and b eliminated.  isochore with molar volume equal
                  For example, for the van der Waals equation (8.2), use of (8.18) to eliminate a and b  to the critical molar volume.
                  and (8.19) to eliminate R gives (Prob. 8.19)
                                                               8
                                                           1
                                                    2
                                           1P   3>V 21V   2    T r                   (8.29)
                                                           3
                                                               3
                                                   r
                                                       r
                                             r
                      If we multiply the law of corresponding states (8.28) by P /T , we get P V /T
                                                                                        r
                                                                                   r r
                                                                          r
                                                                       r
                  P f(P , T )/T . The right side of this equation is some function of P and T , which we
                          r
                                                                                 r
                              r
                       r
                                                                           r
                    r
                  shall call g(P , T ). Thus
                                 r
                              r
                                              P V >T   g1P , T 2                     (8.30)
                                                             r
                                                    r
                                                          r
                                               r r
                  where the function g is approximately the same for all gases.
   269   270   271   272   273   274   275   276   277   278   279