Page 273 - Physical Chemistry
P. 273

lev38627_ch08.qxd  3/14/08  12:54 PM  Page 254


                254
               Chapter 8
               Real Gases                      The table and graph for the isotherm show a local maximum pressure (corre-
                                            sponding to point M in Fig. 8.5) of 19 atm and a minimum pressure of  55 atm.
                                            The vapor pressure must be above zero, and Fig. 8.5 shows that it must be below
                                            the maximum at M of 19 atm. We shall arbitrarily average these limits and take an
                                            initial estimate of the vapor pressure as 9.5 atm. (One could also try and draw the
                                            horizontal line JN to satisfy the equal-area rule, but this is not so easy to do.) To get
                                            the initial estimates of the liquid and vapor molar volumes, we need the isotherm’s
                                            minimum and maximum volumes that correspond to P   9.5 atm (points J and N).
                                                                                3
                                            The spreadsheet table shows that at 100 cm /mol, P is 12.7 atm, which is fairly
                                                                         3
                                                                                                 l
                                            close to 9.5 atm, so we take 100 cm /mol as the initial guess for V . The table also
                                                                                                 m
                                                              3
                                            shows that at 2150 cm /mol, P is close to 9.5 atm, which gives the initial guess for
                                             v
                                                                  3
                                            V . [Of course, the 320 cm /mol value where P   9.5 atm is ignored (point L).]
                                             m
                                               These initial guesses for the three unknowns are entered into cells C3,
                                            E3, and G3 (Fig. 8.6). The right side of Eq. (8.25) is entered as a formula in
                                            C4, and the right sides of the equations in (8.26) are entered as formulas in E4
                                            and G4. For  example, G4 contains the formula  =G1*D2/(E3-E1)-C1/
                                            (E3*(E3+E1)*D2^0.5). The formulas =(C4-C3)/C3,=(E4-C3)/C3,
                                            =(G4-C3)/C3 for the fractional errors are entered in C5, E5, and G5. The
                                            Solver is set up to make C5 equal to zero by changing C3, E3, and G3, subject
                                            to the constraints that E5 and G5 equal zero, that C3 be positive and less than
                                            19 atm, that G3 be greater than 95 and less than 105 (the value in the table where
                                            the pressure first becomes negative), and that E3 be greater than 600 (the volume
                                            at the maximum point M).
                                               With these settings, the Solver quickly converges to the solution  P
                                                       l
                                                                  3
                                                                                     3
                                            10.85 atm, V   100.3 cm /mol, V  v    1823 cm /mol. The experimental values
                                                      m                   m
                                                                              3
                                                              3
                                            are 9.39 atm, 89.5 cm /mol, and 2136 cm /mol. The Redlich–Kwong results are
                                            neither very bad nor very good. If the van der Waals equation is used, the results
                                                                           3
                                                              3
                                            (16.6 atm, 141.6 cm /mol, 1093 cm /mol) are very poor (Prob. 8.14). If the
                                                                                                     3
                                            Peng–Robinson equation is used, the results (9.39 atm, 86.1 cm /mol, 2140
                                              3
                                            cm /mol) are quite good (Prob. 8.16). The Peng–Robinson and the
                                            Soave–Redlich–Kwong (Prob. 8.15) equations are widely used to predict liquid–
                                            vapor equilibrium properties of mixtures.
                                            Exercise
                                            Set up the spreadsheet and verify the results in this example. Then repeat the cal-
                                            culation starting with an initial guess of 16 atm for the vapor pressure and cor-
                                            responding guesses for the molar volumes and see if the Solver finds the answer.
                                            Then repeat with an initial guess of 4 atm and corresponding volumes. Then
                                            repeat the calculation for propane at 0°C. The experimental values are 4.68 atm,
                                                                                                         3
                                                               3
                                                                                            3
                                                  3
                                            83.4 cm /mol, 4257 cm /mol. (Answer: 5.65 atm, 91.3 cm /mol, 3492 cm /mol.)
                         Vapor
                                             The procedure for finding    H from an eos is outlined in Prob. 8.17. The
                                                                      vap
                               Liquid    Redlich–Kwong equation predicts 13.4 kJ/mol for propane at 25°C compared with the
                                         experimental value 14.8 kJ/mol.
                                             The minimum of a Redlich–Kwong isotherm can be used to predict the maximum
                                         tension that a liquid can be subjected to (Prob. 8.18).
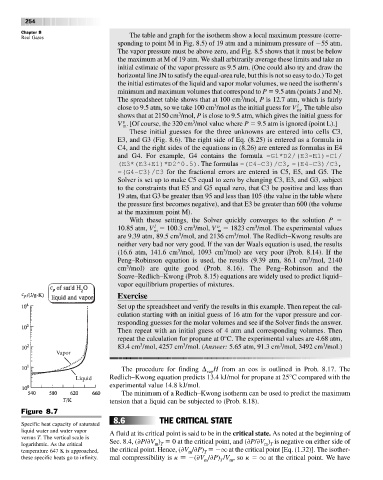
               Figure 8.7
                                          8.6           THE CRITICAL STATE
               Specific heat capacity of saturated
               liquid water and water vapor  A fluid at its critical point is said to be in the critical state. As noted at the beginning of
               versus T. The vertical scale is
                                                                                       m T
                                                       m T
               logarithmic. As the critical  Sec. 8.4, ( P/ V )   0at the critical point, and ( P/ V ) is negative on either side of
               temperature 647 K is approached,  the critical point. Hence, ( V / P)   q at the critical point [Eq. (1.32)]. The isother-
                                                                 m
                                                                     T
               these specific heats go to infinity.  mal compressibility is k    ( V / P) /V ,so k   q at the critical point. We have
                                                                     m    T  m
   268   269   270   271   272   273   274   275   276   277   278