Page 388 - Physical Chemistry
P. 388

lev38627_ch12.qxd  3/18/08  2:41 PM  Page 369


                                                                                                                 369
                  composition x
 when boiled will yield vapor with the same composition as the liquid.       Section 12.6
                              B
                  Since vaporization does not change the liquid’s composition, the entire sample of liq-   Two-Component
                                                                                                     Liquid–Vapor Equilibrium
                  uid will boil at a constant temperature. Such a constant-boiling solution is called an
                  azeotrope. The boiling behavior of an azeotropic solution resembles that of a pure
                  compound and contrasts with that of most solutions of two liquids, which boil over a
                  temperature range. However, since the azeotrope’s composition depends on the pres-
                  sure, a mixture that shows azeotropic behavior at one pressure will boil over a temper-
                  ature range at a different P. Thus, an azeotrope can be distinguished from a compound.
                      Drawing lines in Fig. 12.14b similar to those in Fig. 12.12, we see that fractional
                  distillation of a solution of two substances that form an azeotrope leads to separation
                                                  l
                                                                                 l
                  into either pure B and azeotrope (if x   x
) or pure C and azeotrope (if x   x
). A
                                                  B    B                         B    B
                  liquid–vapor phase diagram with an azeotrope resembles two nonazeotropic liquid–
                  vapor diagrams placed side by side.
                      The most famous azeotrope is that formed by water and ethanol. At 1 atm, the
                  azeotropic composition is 96 percent C H OH by weight (192 proof) and the boiling
                                                    2  5
                  point is 78.2°C, which is below the normal boiling points of water and ethanol.
                  Absolute (100%) ethanol cannot be prepared by distillation at 1 atm of a dilute aque-
                  ous solution of ethanol.
                      A tabulation of known azeotropes is L. H. Horsley, Azeotropic Data III,  Adv.
                  Chem. Ser. 116, American Chemical Society, 1973. About half of the binary systems
                  examined show azeotropes.
                      Figure 12.12 shows that, when no azeotrope is formed, the vapor in equilibrium
                  with a liquid is always richer in the lower-boiling (more volatile) component than the
                  liquid. When, however, a minimum-boiling azeotrope is formed, Fig. 12.14b shows
                  that for some liquid compositions the vapor is richer in the higher-boiling component.
                      A negative deviation from Raoult’s law large enough to give a minimum in the P-
                          l
                  versus-x curve gives a maximum on the T-x phase diagram and a maximum-boiling
                         B                              B
                  azeotrope.
                      If the positive deviation from ideality is large enough, the two liquids may become
                  only partially miscible with each other. Liquid–liquid equilibrium for partially misci-
                  ble liquids is discussed in Sec. 12.7; liquid–vapor equilibrium for this case is consid-
                  ered in Prob. 12.67.
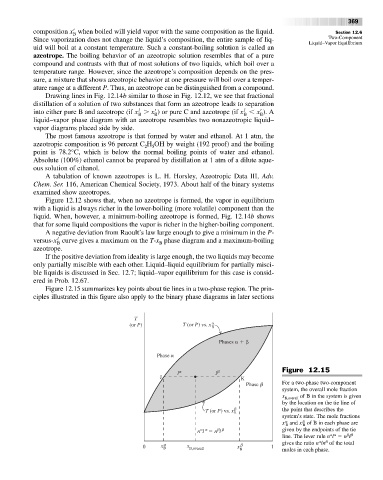
                      Figure 12.15 summarizes key points about tie lines in a two-phase region. The prin-
                  ciples illustrated in this figure also apply to the binary phase diagrams in later sections


                                                 T
                                               (or P)          T (or P) vs. x

                                                                          Phases
                                                       Phase


                                                             l           l                   Figure 12.15
                                                        J                       K
                                                                                  Phase      For a two-phase two-component
                                                                                             system, the overall mole fraction
                                                                                             x B,overall  of B in the system is given
                                                                                             by the location on the tie line of
                                                                                             the point that describes the
                                                                      T (or P) vs. x   B
                                                                                             system’s state. The mole fractions
                                                                                              a
                                                                                                   b
                                                                                             x and x of B in each phase are
                                                                                              B
                                                                                                   B


                                                                   n l    n l                given by the endpoints of the tie
                                                                                                           a a
                                                                                                                b b
                                                                                             line. The lever rule n l   n l
                                                                                                          b
                                                                                                        a
                                                   0     x      x B,overall    x B        1  gives the ratio n /n of the total
                                                         B
                                                                                             moles in each phase.
   383   384   385   386   387   388   389   390   391   392   393