
Page 387 - Physical Chemistry
P. 387
lev38627_ch12.qxd 3/18/08 2:41 PM Page 368
368
l
Chapter 12 Since P* and P* are known functions of T, we can use (12.43) to find x at any given T
C
B
B
Multicomponent Phase Equilibrium and thereby plot the lower (liquid) curve. To plot the vapor curve, we use x P /P
#
v
B B
l
#
x P*/P ; substitution of (12.43) gives
B B
#
P*1T2 P P*1T2
B
C
v
x ideal soln. (12.44)
B
P # P*1T 2 P*1T2
B C
v
which is the desired equation for x as a function of T. Equations (12.43) and (12.44)
B
#
are the same as (12.37) and (12.38), except that P is now fixed at P and T is regarded
as a variable.
Nonideal Solutions
Having examined liquid–vapor equilibrium for ideal solutions, we now consider non-
ideal solutions. Liquid–vapor phase diagrams for nonideal systems are obtained by
P
measurement of the pressure and composition of the vapor in equilibrium with liquid
Liquid
A of known composition. If the solution is only slightly nonideal, the curves resemble
D those for ideal solutions. If, however, the solution has a great enough deviation from
l
P max ideality to give a maximum or minimum in the P-versus-x curve (as in Fig. 9.21), a
B
l
P B * new phenomenon appears.
l
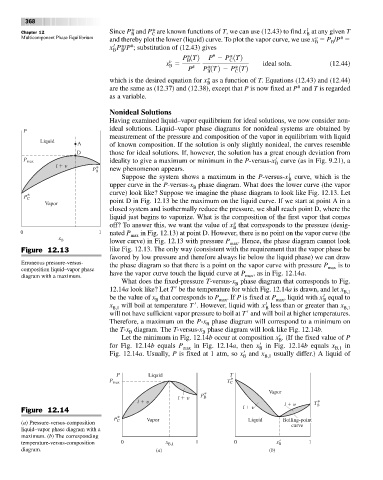
Suppose the system shows a maximum in the P-versus-x curve, which is the
B
upper curve in the P-versus-x phase diagram. What does the lower curve (the vapor
B
curve) look like? Suppose we imagine the phase diagram to look like Fig. 12.13. Let
P * C
Vapor point D in Fig. 12.13 be the maximum on the liquid curve. If we start at point A in a
closed system and isothermally reduce the pressure, we shall reach point D, where the
liquid just begins to vaporize. What is the composition of the first vapor that comes
v
off? To answer this, we want the value of x that corresponds to the pressure (desig-
B
0 1 nated P in Fig. 12.13) at point D. However, there is no point on the vapor curve (the
x B max
lower curve) in Fig. 12.13 with pressure P
max . Hence, the phase diagram cannot look
Figure 12.13 like Fig. 12.13. The only way (consistent with the requirement that the vapor phase be
favored by low pressure and therefore always lie below the liquid phase) we can draw
Erroneous pressure-versus- the phase diagram so that there is a point on the vapor curve with pressure P is to
composition liquid–vapor phase max
diagram with a maximum. have the vapor curve touch the liquid curve at P max , as in Fig. 12.14a.
What does the fixed-pressure T-versus-x phase diagram that corresponds to Fig.
B
12.14a look like? Let T
be the temperature for which Fig. 12.14a is drawn, and let x
B,1
l
be the value of x that corresponds to P . If P is fixed at P , liquid with x equal to
B max max B
l
x will boil at temperature T
. However, liquid with x less than or greater than x
B,1 B B,1
will not have sufficient vapor pressure to boil at T
and will boil at higher temperatures.
Therefore, a maximum on the P-x phase diagram will correspond to a minimum on
B
the T-x diagram. The T-versus-x phase diagram will look like Fig. 12.14b.
B B
Let the minimum in Fig. 12.14b occur at composition x
. (If the fixed value of P
B
for Fig. 12.14b equals P in Fig. 12.14a, then x
in Fig. 12.14b equals x in
max B B,1
Fig. 12.14a. Usually, P is fixed at 1 atm, so x
and x usually differ.) A liquid of
B B,1
P Liquid T
P max T C *
Vapor
*
l P B
l l T *
B
Figure 12.14 l
P * Vapor Liquid Boiling-point
(a) Pressure-versus-composition C curve
liquid–vapor phase diagram with a
maximum. (b) The corresponding
temperature-versus-composition 0 x B,1 1 0 x B ′ 1
diagram. (a) (b)