
Page 383 - Physical Chemistry
P. 383
lev38627_ch12.qxd 3/18/08 2:41 PM Page 364
364
Chapter 12 P
Multicomponent Phase Equilibrium *
P
Liquid (l) B
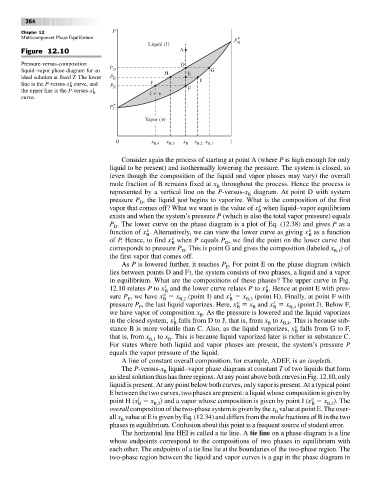
Figure 12.10 A
Pressure-versus-composition D
liquid–vapor phase diagram for an P D H E G
ideal solution at fixed T. The lower P E I
v
line is the P-versus-x curve, and P F J
B
the upper line is the P-versus-x l B l F
curve.
P * C
Vapor ( )
0 x B,4 x B,3 x B x B,2 x B,1 1
Consider again the process of starting at point A (where P is high enough for only
liquid to be present) and isothermally lowering the pressure. The system is closed, so
(even though the composition of the liquid and vapor phases may vary) the overall
mole fraction of B remains fixed at x throughout the process. Hence the process is
B
represented by a vertical line on the P-versus-x diagram. At point D with system
B
pressure P , the liquid just begins to vaporize. What is the composition of the first
D
v
vapor that comes off? What we want is the value of x when liquid–vapor equilibrium
B
exists and when the system’s pressure P (which is also the total vapor pressure) equals
P . The lower curve on the phase diagram is a plot of Eq. (12.38) and gives P as a
D
v
v
function of x . Alternatively, we can view the lower curve as giving x as a function
B B
v
of P. Hence, to find x when P equals P , we find the point on the lower curve that
B D
corresponds to pressure P . This is point G and gives the composition (labeled x ) of
D B,1
the first vapor that comes off.
As P is lowered further, it reaches P . For point E on the phase diagram (which
E
lies between points D and F), the system consists of two phases, a liquid and a vapor
in equilibrium. What are the compositions of these phases? The upper curve in Fig.
v
l
12.10 relates P to x and the lower curve relates P to x . Hence at point E with pres-
B
B
v
l
sure P , we have x x (point I) and x x (point H). Finally, at point F with
E B B,2 B B,3
v
l
pressure P , the last liquid vaporizes. Here, x x and x x (point J). Below F,
F B B B B,4
we have vapor of composition x . As the pressure is lowered and the liquid vaporizes
B
l
in the closed system, x falls from D to J, that is, from x to x . This is because sub-
B B B,4
v
stance B is more volatile than C. Also, as the liquid vaporizes, x falls from G to F,
B
that is, from x to x . This is because liquid vaporized later is richer in substance C.
B,1 B
For states where both liquid and vapor phases are present, the system’s pressure P
equals the vapor pressure of the liquid.
A line of constant overall composition, for example, ADEF, is an isopleth.
The P-versus-x liquid–vapor phase diagram at constant T of two liquids that form
B
an ideal solution thus has three regions. At any point above both curves in Fig. 12.10, only
liquid is present. At any point below both curves, only vapor is present. At a typical point
E between the two curves, two phases are present: a liquid whose composition is given by
v
l
point H (x x ) and a vapor whose composition is given by point I (x x ). The
B B,3 B B,2
overall composition of the two-phase system is given by the x value at point E. The over-
B
all x value at E is given by Eq. (12.34) and differs from the mole fractions of B in the two
B
phases in equilibrium. Confusion about this point is a frequent source of student error.
The horizontal line HEI is called a tie line. A tie line on a phase diagram is a line
whose endpoints correspond to the compositions of two phases in equilibrium with
each other. The endpoints of a tie line lie at the boundaries of the two-phase region. The
two-phase region between the liquid and vapor curves is a gap in the phase diagram in