
Page 115 - Pipeline Risk Management Manual Ideas, Techniques, and Resources
P. 115
5/92 Design Index
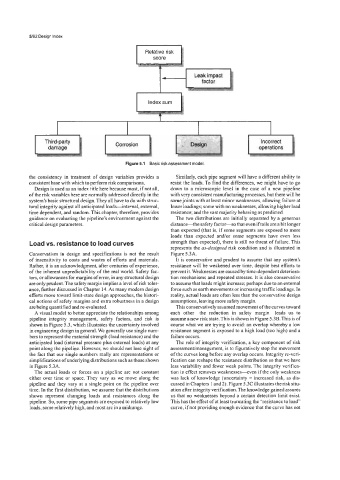
Figure 5.1 Basic risk assessment model
the consistency in treatment of design variables provides a Similarly, each pipe segment will have a different ability to
consistent base with which to perform risk comparisons. resist the loads. To find the differences, we might have to go
Design is used as an index title here because most, if not all, down to a microscopic level in the case of a new pipeline
of the risk variables here are normally addressed directly in the with very consistent manufacturing processes, but there will be
system’s basic structural design. They all have to do with struc- some joints with at least minor weaknesses, allowing failure at
tural integrity against all anticipated loads-inteqal, external, lower loadings; some with no weaknesses, allowing higher load
time dependent, and random. This chapter, therefore, provides resistance; and the vast majority behaving as predicted.
guidance on evaluating the pipeline’s environment against the The two distributions are initially separated by a generous
critical design parameters. distancethe safety factor-so that even iftails are a bit longer
than expected (that is, if some segments are exposed to more
loads than expected andor some segments have even less
Load vs. resistance to load curves strength than expected), there is still no threat of failure. This
represents the as-designed risk condition and is illustrated in
Conservatism in design and specifications is not the result Figure 5.3A.
of insensitivity to costs and wastes of efforts and materials. It is conservative and prudent to assume that any system’s
Rather, it is an acknowledgment, after centuries of experience, resistance will be weakened over time, despite best efforts to
of the inherent unpredictability of the real world. Safety fac- prevent it. Weaknesses are caused by time-dependent deteriora-
tors, or allowances for margins of error, in any structural design tion mechanisms and repeated stresses. It is also conservative
are only prudent. The safety margin implies a level of risk toler- to assume that loads might increase; perhaps due to an external
ance, fiuther discussed in Chapter 14. As many modem design force such as earth movements or increasing traffic loadings. In
efforts move toward limit-state design approaches, the histori- reality, actual loads are often less than the conservative design
cal notions of safety margins and extra robustness in a design assumptions, leaving more safety margin.
are being quantified and re-evaluated. This conservatively assumed movement of the curves toward
A visual model to better appreciate the relationships among each other-the reduction in safety margin-leads us to
pipeline integrity management, safety factors, and risk is assume anew risk state. This is shown in Figure 5.3B. This is of
shown in Figure 5.3, which illustrates the uncertainty involved course what we are trying to avoid an overlap whereby a low
in engineering design in general. We generally use single num- resistance segment is exposed to a high load (too high) and a
bers to represent the material strength (load resistance) and the failure occurs.
anticipated load (internal pressure plus external loads) at any The role of integrity verification, a key component of risk
point along the pipeline. However, we should not lose sight of assessmenVmanagement, is to figuratively stop the movement
the fact that our single numbers really are representations or of the curves long before any overlap occurs. Integrity re-veri-
simplifications of underlying distributions such as those shown fication can reshape the resistance distribution so that we have
in Figure 5.3A. less variability and fewer weak points. The integrity verifica-
The actual loads or forces on a pipeline are not constant tion in effect removes weaknesses-ven if the only weakness
either over time or space. They vary as we move along the was lack of knowledge (uncertainty = increased risk, as dis-
pipeline and they vary at a single point on the pipeline over cussed in Chapters 1 and2). Figure 5.3C illustrates the risk situ-
time. In the first distribution, we assume that the distributions ation after integrity verification. The knowledge gained assures
shown represent changing loads and resistances along the us that no weaknesses beyond a certain detection limit exist.
pipeline. So, some pipe segments are exposed to relatively low This has the effect of at least truncating the “resistance to load”
loads, some relatively high, and most are in a midrange. curve, if not providing enough evidence that the curve has not