
Page 116 - Pipeline Risk Management Manual Ideas, Techniques, and Resources
P. 116
New pipelines 5/93
Maximum pressure
Normal pressure
Material strength
Pipe wall thickness
External loadings
Diameter
Strength of fittings, valves, components
Pressure cycle magnitude
Pressure cycle frequency
Material toughness
Safety factor Diameter/wall thickness ratio
Fatigue
Fluid bulk modulus
Surge potential 4 Pipe modulus of elasticity
Rate of flow stoppage
Flow rates
Integrity verifications
Verification date
Land movements Pressure test level
In-line inspection technique
In-line inspection accuracy
Seismic shaking
Fault movement
Subsidence
Landslide
Water bank erosion
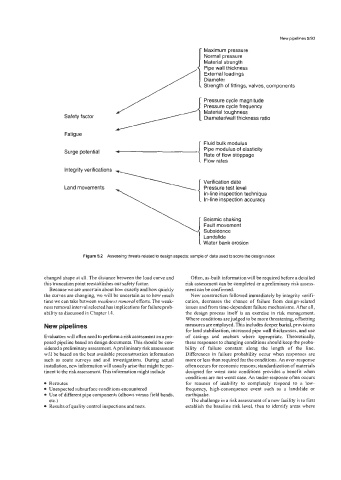
Figure 5.2 Assessing threats related to design aspects: sample of data used to score the design index
changed shape at all. The distance between the load curve and Often, as-built information will be required before a detailed
this truncation point reestablishes our safety factor. risk assessment can be completed or a preliminary risk assess-
Because we are uncertain about how exactly and how quickly ment can be confirmed.
the curves are changing, we will be uncertain as to how much New construction followed immediately by integrity verifi-
time we can take between weakness removal efforts. The weak- cation, decreases the chance of failure from design-related
ness removal interval selected has implications for failure prob- issues and from time-dependent failure mechanisms. After all,
ability as discussed in Chapter 14. the design process itself is an exercise in risk management.
Where conditions are judged to be more threatening, offsetting
New pipelines measures are employed. This includes deeper burial, provisions
for land stabilization, increased pipe wall thicknesses, and use
Evaluators will often need to perform a risk assessment on apro- of casings and anchors where appropriate. Theoretically,
posed pipeline based on design documents. This should be con- these responses to changing conditions should keep the proba-
sidered a preliminary assessment. A preliminary risk assessment bility of failure constant along the length of the line.
will be based on the best available preconstmction information Differences in failure probability occur when responses are
such as route surveys and soil investigations. During actual more or less than required for the conditions. An over-response
installation, new information will usually arise that might be per- often occurs for economic reasons; standardization of materials
tinent to the risk assessment. This information might include designed for worst case conditions provides a benefit when
conditions are not worst case. An under-response often occurs
Reroutes for reasons of inability to completely respond to a low-
Unexpected subsurface conditions encountered frequency, high-consequence event such as a landslide or
Use of different pipe components (elbows versus field bends, earthquake.
etc.) The challenge in a risk assessment of a new facility is to first
Results of quality control inspections and tests. establish the baseline risk level, then to identify areas where