
Page 178 - Pipeline Risk Management Manual Ideas, Techniques, and Resources
P. 178
Scoring releases 7/155
models for dispersion and thermal effects. As is noted in the tor can be very close to a leak site and not suffer any damages,
introductory chapters of this hook, the challenge when con- depending on variables such as wind strength and direction,
structing a risk assessment model is to fully understand the topography, or the presence ofbarriers.
mechanisms at work and then to identify the optimum number
of variables for the model's intended use. For instance, Table Scoring hazardous liquid releases
7.8 implies that overpressure (blast effects from a detonation) is
not a consideration for natural gas. This is a modeling simplifi- As discussed, a relative assessment of potential consequences
cation. Unconfined vapor cloud explosions involving methane from a liquid spill should include relative measures of contami-
have not been recorded, hut confined vapor cloud explosions nation and thermal effects potential, both of which are a func-
are certainly possible. tion of spill volume. Contamination area is normally assumed
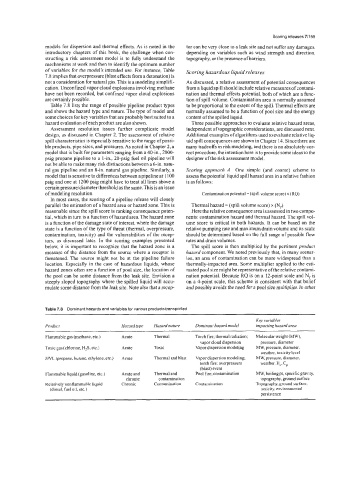
Table 7.8 lists the range of possible pipeline product types to be proportional to the extent of the spill. Thermal effects are
and shows the hazard type and nature. The type of model and normally assumed to be a function of pool size and the energy
some choices for key variables that are probably best suited to a content of the spilled liquid.
hazard evaluation of each product are also shown. Three possible approaches to evaluate relative hazard areas,
Assessment resolution issues further complicate model independent of topographic considerations, are discussed next.
design, as discussed in Chapter 2. The assessment of relative Additional examples of algorithms used to evaluate relative liq-
spill characteristics is especially sensitive to the range of possi- uid spill consequences are shown in Chapter 14. Since there are
ble products, pipe sizes, and pressures. As noted in Chapter 2, a many tradeoffs in risk modeling, and there is no absolutely cor-
model that is built for parameters ranging from a 40-in., 2000- rect procedure, the intention here is to provide some ideas to the
psig propane pipeline to a I-in., 20-psig fuel oil pipeline will designer of the risk assessment model.
not be able to make many risk distinctions between a 6-in. natu-
ral gas pipeline and an 8411. natural gas pipeline. Similarly, a Scoring approach A One simple (and coarse) scheme to
model that is sensitive to differences between a pipeline at 1 100 assess the potential liquid spill hazard area in a relative fashion
psig and one at 1200 psig might have to treat all lines above a is as follows:
certain pressure/diameter threshold as the same. This is an issue
of modeling resolution. Contamination potential = (spill volume score) x (RQj
In most cases, the scoring of a pipeline release will closely
parallel the estimation of a hazard area or hazard zone. This is Thermal hazard= (spill volume score) x (N,)
reasonable since the spill score is ranking consequence poten- Here the relative consequence area is assessed in two compo-
tial, which in turn is a function of hazard area. The hazard zone nents: contamination hazard and thermal hazard. The spill vol-
is a function of the damage state of interest, where the damage ume score is critical in both hazards. It can be based on the
state is a function of the type of threat (thermal, overpressure, relative pumping rate and maximum drain volume and its scale
contamination, toxicity) and the vulnerabilities of the recep- should be determined based on the full range of possible flow
tors, as discussed later. In the scoring examples presented rates and drain volumes.
below, it is important to recognize that the hazard zone is a The spill score is then multiplied by the pertinent product
measure of the distance from the source where a receptor is hazard component. We noted previously that, in many scenar-
threatened. The source might not he at the pipeline failure ios, an area of contamination can be more widespread than a
location. Especially in the case of hazardous liquids, whose thermally-impacted area. Some multiplier applied to the esti-
hazard zones often are a function of pool size, the location of mated pool size might be representative of the relative contami-
the pool can be some distance from the leak site. Envision a nation potential. Because RQ is on a 12-point scale and N, is
steeply sloped topography where the spilled liquid will accu- on a 4-point scale, this scheme is consistent with that belief
mulate some distance from the leak site. Note also that a recep- and possibly avoids the need for a pool size multiplier. In other
Table 7.8 Dominant hazards and variables for various products transported
~~
Key variables
Product Hazard tjpe Hazard nature Dominant hazard model impacting hazard area
Flammable gas (methane, etc.) Acute Thermal Torch fire; thermal radiation; Molecular weight (MW).
vapor cloud dispersion pressure, diameter
Toxic gas (chlorine, H2S, etc.) Acute TOXlC Vapor dispersion modeling MW, pressure, diameter,
weather, toxicity level
HVL (propane, butane. ethylene, etc.) Acute Thermal and blast Vapor dispersion modeling; MW, pressure, diameter,
torch fire; overpressure weather, H,, C,
(blast) event
Flammable liquid (gasoline, etc.) Acute and Thermal and Pool fire; contamination MW, boiling pt, specific gravity,
chronic contamination topography, ground surface
Relatively nonflammable liquid Chronic Contamination Contamination Topography, ground surface,
(diesel, fuel oil, etc.) toxicity. environmental
persistence