
Page 179 - Pipeline Risk Management Manual Ideas, Techniques, and Resources
P. 179
7/156 Leak Impact Factor
words, this approach uses the scales for RQ and N, as a simpli- main threat is to groundwater, so soil permeability is a key
fication to show the perceived relationships between conse- determinant.
quence area and product characteristics. The problem is simplified here to two factors: leak volume
This scheme is based on an understanding of the underlying and soil permeability (or its equivalent if a release into water is
variables and seems intuitively valid as a mechanism for rela- being studied). Points can be assessed based on the quantity of
tive comparisons. It captures, for example, the idea that a gaso- product spilled, under a worst case scenario. The worst-case
line and a fuel oil spill of the same quantity have equivalent scenario can range from a large volume, sudden spill to a very
contamination potential but the gasoline potentially produces slow, below-detection-limits spill.
more thermal effects. However, this or any proposed algorithm
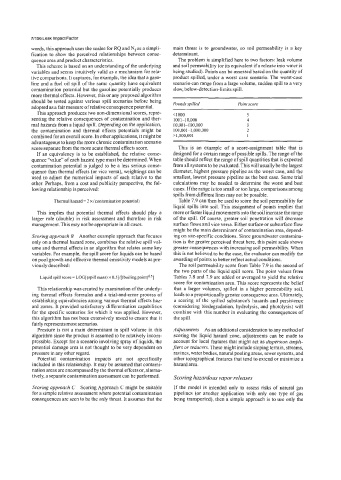
should be tested against various spill scenarios before being Pounds spilled Point score
adopted as a fair measure of relative consequence potential.
This approach produces two non-dimensional scores, repre- < 1000
senting the relative consequences of contamination and ther- 100 1-1 0,000
mal hazards from a liquid spill. Depending on the application, 10,001-100,000
the contamination and thermal effects potentials might be 100,001-1,000,000
combined for an overall score. In other applications, it might be >1,000,001
advantageous to keep the more chronic contamination scenario
score separate from the more acute thermal effects score. This is an example of a score-assignment table that is
If an equivalency is to be established, the relative conse- designed for a certain range of possible spills. The range of the
quence “value” of each hazard type must be determined. When table should reflect the range of spill quantities that is expected
contamination potential is judged to be a less serious conse- from all systems to be evaluated. This will usually be the largest
quence than thermal effects (or vice versa), weightings can be diameter, highest pressure pipeline as the worst case, and the
used to adjust the numerical impacts of each relative to the smallest, lowest pressure pipeline as the best case. Some trial
other. Perhaps, from a cost and publicity perspective, the fol- calculations may be needed to determine the worst and best
lowing relationship is perceived: cases. lfthe range is too small or too large, comparisons among
spills from different lines may not be possible.
Thermal hazard = 2 x (contamination potential) Table 7.9 can then be used to score the soil permeability for
liquid spills into soil. This assignment of points implies that
This implies that potential thermal effects should play a more or faster liquid movements into the soil increase the range
larger role (double) in risk assessment and therefore in risk of the spill. Of course, greater soil penetration will decrease
management. This may not be appropriate in all cases. surface flows and vice versa. Either surface or subsurface flow
might be the main determinant of contamination area, depend-
Scoring approach B Another example approach that focuses ing on site-specific conditions. Since groundwater contamina-
only on a thermal hazard zone, combines the relative spill vol- tion is the greater perceived threat here, this point scale shows
ume and thermal effects in an algorithm that relates some key greater consequences with increasing soil permeability. When
variables. For example, the spill score for liquids can be based this is not believed to be the case, the evaluator can modify the
on pool growth and effective thermal emissivity models as pre- awarding of points to better reflect actual conditions.
viously described: The soil permeability score from Table 7.9 is the second of
the two parts of the liquid spill score. The point values from
Liquid spill score = LOG[(spill mass) x 0.5]/[(hoiling p~int)~-~] Tables 7.8 and 7.9 are added or averaged to yield the relative
score for contamination area. This score represents the belief
This relationship was created by examination of the underly- that a larger volumes, spilled in a higher permeability soil,
ing thermal effects formulas and a trial-and-error process of leads to a proportionally greater consequence area. Ultimately,
establishing equivalencies among various thermal effects haz- a scoring of the spilled substance’s hazards and persistence
ard zones. It provided satisfactory differentiation capabilities (considering biodegradation, hydrolysis, and photolysis) will
for the specific scenarios for which it was applied. However, combine with this number in evaluating the consequences of
this algorithm has not been extensively tested to ensure that it the spill.
fairly represents most scenarios.
Pressure is not a main determinant in spill volume in this Adjustments As an additional consideration to any method of
algorithm since the product is assumed to be relatively incom- scoring the liquid hazard zone, adjustments can be made to
pressible. Except for a scenario involving spray of liquids, the account for local features that might act as dispersion ampli-
potential damage area is not thought to be very dependent on fiers or reducers. These might include sloping terrain, streams,
pressure in any other regard. ravines, water bodies, natural pooling areas, sewer systems, and
Potential contamination impacts are not specifically other topographical features that tend to extend or minimize a
included in this relationship. It may be assumed that contami- hazard area.
nation areas are encompassed by the thermal effects or, alterna-
tively, a separate contamination assessment can be performed. Scoring hazardous vapor releases
Scoring approach C Scoring Approach C might be suitable If the model is intended only to assess risks of natural gas
for a simple relative assessment where potential contamination pipelines (or another application with only one type of gas
consequences are seen to be the only threat. It assumes that the being transported), then a simple approach is to use only the