
Page 181 - Pipeline Risk Management Manual Ideas, Techniques, and Resources
P. 181
7/158 Leak Impact Factor
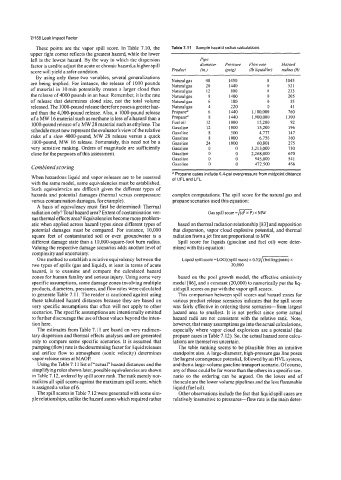
These points are the vapor spill score. In Table 7.10, the Table 7.11 Sample hazard radius calculations
upper right comer reflects the greatest hazard, while the lower
left is the lowest hazard. By the way in which the dispersion Pipe
factor is used to adjust the acute or chronic hazard, a higher spill diameter Pressure Flow rate Hazard
score will yield a safer condition. Product (in.) (psig) (Ib liquid/hr) mdius (f?)
By using only these two variables, several generalizations
are being implied. For instance, the release of 1000 pounds Naturalgas 40 1450 0 1045
521
20
Naturalgas
1440
0
of material in IO min potentially creates a larger cloud than Naturalgas 12 800 0 233
the release of 4000 pounds in an hour. Remember, it is the rate Natural gas 8 1400 0 205
of release that determines cloud size, not the total volume Naturalgas 6 180 0 55
released. The 1000-pound release therefore poses a greater haz- Naturalgas 4 220 0 41
ard than the 4,000-pound release. Also, a 1000-pound release Propane“ 6 1440 1,100,000 760
of a MW 16 material such as methane is less of a hazard than a Propane“ 8 1440 1,900,000 1300
1000-pound release of a MW 28 material such as ethylene. The Fuel oil 12 1000 15,200 92
schedule must now represent the evaluator’s view ofthe relative Gasoline 12 1000 15,200 196
Gasoline
8
147
500
4,777
risks of a slow 4000-pound, MW 28 release versus a quick Gasoline 8 1000 6,756 160
1000-pound, MW 16 release. Fortunately, this need not be a Gasoline 24 1000 60,801 275
very sensitive ranking. Orders of magnitude are sufficiently Gasoline 0 0 3,213,000 730
close for the purposes of this assessment. Gasoline 0 0 2,268,000 670
Gasoline 0 0 945,000 54 1
Gasoline 0 0 472,500 456
Combined scoring
a Propane cases include 0.4-psi overpressure from midpoint distance
When hazardous liquid and vapor releases are to be assessed of UFL and LFL.
with the same model, some equivalencies must be established.
Such equivalencies are difficult given the different types of
hazards and potential damages (thermal versus overpressure complex computations. The spill score for the natural gas and
versus contamination damages, for example). propane scenarios used this equation:
A basis of equivalency must first be determined: Thermal Gas spill score =e)
radiation only? Total hazard area? Extent of contamination ver- x MW
sus thermal effects area? Equivalencies become more problem-
atic when applied across hazard types since different types of based on thermal radiation relationship [83] and supposition
potential damages must be compared. For instance, 10,000 that dispersion, vapor cloud explosive potential, and thermal
square feet of contaminated soil or even groundwater is a radiation from a jet fire are proportional to MW.
different damage state than a 10,000-square-foot burn radius. Spill score for liquids (gasoline and fuel oil) were deter-
Valuing the respective damage scenarios adds another level of mined with this equation:
complexity and uncertainty.
One method to establish a relative equivalency between the Liquid spill score =LOG[(spill mass) x 0.5]//-) x
two types of spills (gas and liquid), at least in terms of acute 20,000
hazard is to examine and compare the calculated hazard
zones for buman fatality and serious injury. Using some very based on the pool growth model, the effective emissivity
specific assumptions, some damage zones involving multiple model [86], and a constant (20,000) to numerically put the liq-
products, diameters, pressures, and flow rates were calculated uid spill scores on par with the vapor spill scores.
to generate Table 7.11. The reader is cautioned against using This comparison between spill scores and hazard zones for
these tabulated hazard distances because they are based on various product release scenarios indicates that the spill score
very specific assumptions that often will not apply to other was fairly effective in ordering these scenarios-from largest
scenarios. The specific assumptions are intentionally omitted hazard area to smallest. It is not perfect since some actual
to further discourage the use of these values beyond the inten- hazard radii are not consistent with the relative rank. Note,
tion here. however, that many assumptions go into the actual calculations,
The estimates from Table 7.1 1 are based on very rudimen- especially where vapor cloud explosions are a potential (the
tary dispersion and thermal effects analyses and are generated propane cases in Table 7.12). So, the actual hazard zone calcu-
only to compare some specific scenarios. It is assumed that lations are themselves uncertain.
pumping (flow) rate is the determining factor for liquid releases The table ranking seems to be plausible from an intuitive
and orifice flow to atmosphere (sonic velocity) determines standpoint also. A large-diameter, high-pressure gas line poses
vapor release rates at MAOP. the largest consequence potential, followed by an HVL system,
Using the Table 7.11 list of “actual” hazard distances and the and then a large-volume gasoline transport scenario. Of course,
simplifying rules shown later, possible equivalencies are shown any ofthese could be far worse than the others in a specific sce-
in Table 7.12, ordered by spill score rank. The rank merely nor- nario so the ordering can be argued. On the lower end of
malizes all spill scores against the maximum spill score, which the scale are the lower volume pipelines and the less flammable
is assigned a value of 6. liquid (fuel oil).
The spill scores in Table 7.12 were generated with some sim- Other observations include the fact that liquid spill cases are
ple relationships, unlike the hazard zones which required rather relatively insensitive to pressures-flow rate is the main deter-