
Page 180 - Pipeline Risk Management Manual Ideas, Techniques, and Resources
P. 180
Scoring Releases 11157
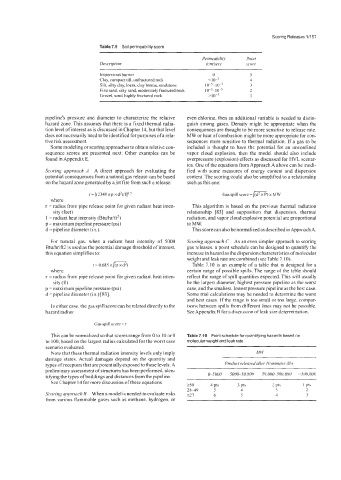
Table 7.9 Soil permeability score
Permeabilih. Point
Description Icrnhec) score
Impervious barrier 0 5
Clay, compact till, unfractured rock 40-7 4
Silt, silty clay, loess, clay loams, sandstone I 0-5 -I 0-7 3
Fine sand, silty sand moderately fractured rock 10-3-10-5 2
Gravel, sand highly fractured rock > Io-' I
pipelineS pressure and diameter to characterize the relative even chlorine, then an additional variable is needed to distin-
hazard zone. This assumes that there is a fixed thermal radia- guish among gases. Density might be appropriate when the
tion level of interest as is discussed in Chapter 14, but that level consequences are thought to be more sensitive to release rate.
does not necessarily need to be identified for purposes of a rela- MW or heat of combustion might be more appropriate for con-
tive risk assessment. sequences more sensitive to thermal radiation. If a gas to be
Some modeling or scoring approaches to obtain relative con- included is thought to have the potential for an unconfined
sequence scores arc presented next. Other examples can be vapor cloud explosion, then the model should also include
found in Appendix E. overpressure (explosion) effects as discussed for HVL scenar-
ios. One of the equations from ApproachA above can be modi-
Scoring approach A A direct approach for evaluating the fied with some measures of energy content and dispersion
potential consequences from a natural gas release can be based content. The scoring could also be simplified to a relationship
on the hazard zone generated by a jet fire from such a release: such as this one:
r=[(2348~pxd')/I]~~ Gas spill score =m) x MW
where
r =radius from pipe release point for given radiant heat inten- This algorithm is based on the previous thermal radiation
sity (feet) relationship [83] and supposition that dispersion. thermal
I =radiant heat intensity (Btuihr/ft*) radiation, and vapor cloud explosive potential are proportional
p =maximum pipeline pressure (psi) to MW.
d = pipeline diameter (in.). This score can also be normalized as described in Approach A.
For natural gas, when a radiant heat intensity of 5000 Scoring approach C As an even simpler approach to scoring
Btulhrift2 is used as the potential damage threshold of interest, gas releases, a point schedule can be designed to quantify the
this equation simplifies to: increase in hazard as the dispersion characteristics of molecular
weight and leak rate are combined (see Table 7.10).
r = 0.685 x p ) Table 7.10 is an example of a table that is designed for a
where certain range of possible spills. The range of the table should
r = radius from pipe release point for given radiant heat inten- reflect the range of spill quantities expected. This will usually
sity (ft) be the largest diameter, highest pressure pipeline as the worst
p = maximum pipeline pressure (psi) case, and the smallest, lowest pressure pipeline as the best case.
d= pipeline diameter (in.) [83]. Some trial calculations may be needed to determine the worst
and best cases. If the range is too small or too large, compar-
In either case, the gas spill score can be related directly to the isons between spills from different lines may not be possible.
hazard radius: See Appendix B for a discussion of leak size determination.
Gas spill score = r
This can be normalized so that scores range from 0 to 10 or 0 Table 7.10 Point schedule for quantifying hazards based on
to 100, based on the largest radius calculated for the worst case molecularweight and leak rate
scenario evaluated.
Note that these thermal radiation intensity levels only imply MW
damage states. Actual damages depend on the quantity and
types of receptors that are potentially exposed to these levels. A Produc f releasedafier 10 mrnufes (Ih)
preliminary assessment of structures has been performed iden-
tifying the types ofbuildings and distances from the pipeline. 0-5000 5000-50.000 50. 000-500,000 >500.000
See Chapter 14 for more discussion ofthese equations. 250 4 pts 3 pts 2 pta I pta
2849 5 4 3 2
Scoring approach B When a model is needed to evaluate risks <27 6 5 4 3
from various flammable gases such as methane, hydrogen, or