
Page 353 - Pipeline Risk Management Manual Ideas, Techniques, and Resources
P. 353
14/328 Absolute Risk Estimates
and/or gas fires created by each potential accident identified in performed for each of the twelve pipeline sections and six well
Task 1. Calculations were repeated for numerous combinations of locations.
wind speed and atmospheric stability conditions in order to account
for the effects of local weather data. For each pipeline section or well site, one particular accident will
create the largest potentially lethal hazard zone for that section. As an
When making these calculations, it was assumed that large releases example, one accident is a full rupture ofthe pipeline without ignition
of gas (ruptures and punctures) from underground pipelines were of the flammable cloud, thus resulting in a possible toxic exposure
capable of blowing away the soil overburden because of the pipeline’s downwind of the release. Under worst case atmospheric conditions,
high operating pressure. As a result, the released gas enters the atmos- the toxic hazard zone extends 2.600 feet from the point of release.
phere with high velocity, resulting in rapid mixing with air near the Under the worst case conditions, it takes about 11 minutes for the
point ofrelease. For corrosion holes, it was assumed that the gas being cloud to reach its maximum extent. The hazard “footprint” associated
released from an underground pipeline was incapable of blowing with this event is illustrated in two ways. One method presents the
away the soil overburden. As a result, the released gas enters the footprint as a “hazard corridor” that extends 2,600 feet on both sides
atmosphere with little momentum after passing through the soil above of the pipeline for the entire length. This presentation is misleading
the pipeline. since everyone within this comdor cannot be simultaneously exposed
to potentially lethal hazards from any single accident. A more realistic
The number of persons expected to receive fatal injuries due to illustration of the maximum potential hazard zone along the pipeline
exposure to each of the toxic or fire hazard zones was determined is the hazard footprint that would be expected IF a full rupture of the
as a function of wind direction. The risk was then calculated by pipeline were to occur, AND the wind is blowing perpendicular to the
summing the potential exposures to each ofthe hazards for all acci- pipeline at a low speed, AND “worst case” atmospheric conditions
dents identified in Task 1, and modifying the exposures to each exist, AND the vapor cloud does not ignite. The probability of the
potential hazard zone by its probability of occurrence. For example, simultaneous occurrence of these conditions is about 1.87E-07
the probability of a specific flash fire is the product of the follow- occurrences/pipeline mile-year, or approximately once in 5,330,000
ing probabilities. years.
Probability ofthe accident that releases sour natural gas. The highest risk along this section ofthe pipeline network is to per-
Probability that the release creates a flammable vapor cloud under a sons located immediately above the pipeline. The maximum risk
unique combination of wind speed, wind direction, and atmos- posed by this portion of pipeline is about 5.0E-6 chances of fatality
pheric stability conditions. per year. This is for an individual located directly above the pipeline
Probability that the flammable vapor cloud is not ignited immedi- 24 hours per day for 365 days. In other words, an individual in this
ately but is ignited after some delay. area of the pipeline network would have one chance in 200,000 of
being fatally injured by some release from the pipeline for an entire
The number of persons potentially exposed to a specific hazard zone year, if this individual remained directly above the pipeline for an
is a function of the population density and distribution near the acci- entire year. An individual in this same area, but located 50 meters
dent location. The population density varies along each pipeline sec- from the pipeline, would have about one chance in one million of
tion, and many ofthe sections do not have any permanent dwellings or being fatally injured by a release from the pipeline, if the individual
population close enough to the pipeline to be affected by a pipeline were present at that location for the entire year.
release. In addition, some ofthe physical aspects ofthe pipeline (e.g.,
pipe diameter and operating pressure) and the composition of the gas The risk posed to the population within the appropriate “hazard
in the pipeline also vary with location. Therefore, the pipelineiwell comdor” for the pipeline/well network can also be presented in the
network was divided into twelve pipeline sections and six well sites on form of fM curves. This type ofrisk presentation, often called societal
the basis of pipeline diameter, operating pressure, and local popula- risk, is a plot of the frequency, f, at which N or more persons are
tion density. Calculations ofexpected failure rates and exposures were expected to be fatally injured. The fM curve shows that the frequency
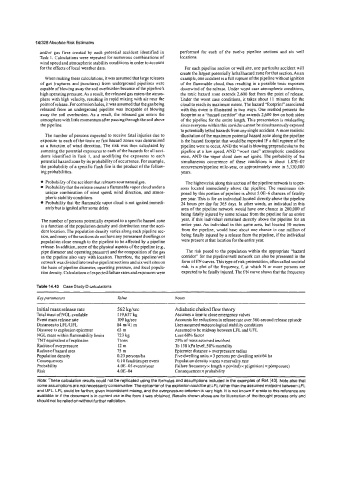
Table 14.43 Case Study D calculations
Keyparameters Volue Notes
Initial mass release rate 562 kg/sec Adiabatic choked flow theory
Total mass ofNGL available 119,657 kg Assumes a time to close emergency valves
Event mass release rate 109 kg/sec Accounts for reductions in release rate Over 360-second release episode
Distances to LFLAJFL 84 m/41 m Uses assumed meteorological stability conditions
Distance to explosion epicenter 63 m Assumed to be midway between LFL and UFL
NGL mass within flammability limits 723 kg Uses 60% factor
TNT equivalent of explosion 7 tons 20% ofmass assumed involved
Radius of overpressure 12 m To 138 Walevel, 50%mortality
Radius of hazard area 75 m Epicenter distance + overpressure radius
Population density 0.23 personsha Five dwelling units x 3 persons per dwelling unifi64 ha
Consequences 0.10 fatalities per event Population density x area x mortality rate
Probability 4.0E-05 eventslyear Failure frequency x length x p(wind) x p(ignition) x p(exposure)
Risk 4.OE44 Consequences x probability
Note: These calculation results could not be replicated using the formulas and assumptions included in the examples of Ref. [43]. Note also that
some assumptions are not necessarily conservative: The epicenter of the explosion could be at LFL ratherthan the assumed midpoint between LFL
and UFL. LFL could be farther, given inconsistent mixing, and the overpressure criterion is very high. It is not known if errata to this reference are
available or if the document is in current use in the form it was obtained. Results shown above are for illustration of the thought process only and
should not be relied on without further validation.