
Page 351 - Pipeline Risk Management Manual Ideas, Techniques, and Resources
P. 351
a
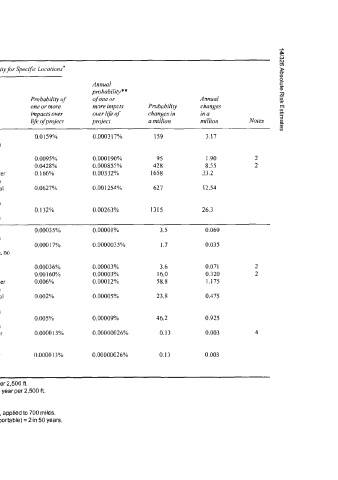
Table 6 Segment-Specific Impact Probabilities for Cases 3 and 4 2
m
Impact Probabilityfir Specific Locations’ D
::
5
Estimated Annual 0
leak probabilify** a
count for Pmbabiligof of one or Annual X
Average leak 700 miles one or more more impcts Probability changes m
rateper and impacts over over life of changes in in a 8
Case c. mile-year 5Oyears Impact life ofproject project a million million Notes
I
3 Re-mitigation 0.001991 69.1 Drinking water 0.0159% 0.000317% 159 3.17
leak rate contamination
estimate
Fatality 0.0095% 0.0001 90% 95 1.90 2
Injury 0.0428% 0.000855% 428 8.55 2
Recreational water 0.166% 0.00332% 1658 33.2
contamination
prime agricultural 0.0627% 0.001 254% 627 12.54
land
contamination
Wetlands 0.132% 0.00263% 1315 26.3
contamination
4 Post-mitigation 0.000073 2.6 Drinking water 0.00035% 0.00001% 3.5 0.069
leak rate contamination
estimate Drinking water 0.0001 7% 0.0000035% 1.7 0.035
contamination. no
MTBE
Fatality 0.00036% 0.00003% 3.6 0.07 1 2
Injury 0.00160% 0.00003% 16.0 0.320 2
Recreational water 0.006% 0.00012% 58.8 1.175
contamination
Prime agricultural 0.002% 0.00005% 23.8 0.475
land
contamination
Wetlands 0.005% 0.00009% 46.2 0.925
contamination
LakeTravis water 0.0000 13% 0.00000026% 0.13 0.003 4
supply
contamination
Edwards Aquifer 0.00001 3% 0.00000026% 0.13 0.003
water
contamination
* Impact probability for specific locations is probability of one or more events in 50 years per 2,500 ft.
*’ Impact probability for specific locations, annual, is probability of one or more events in 1 year per 2.500 fl.
Notes:
1 26 leaks (some less than 50 bbl) over450 miles in 29 years.
2 Fatali and injury rates are based on DOT fatality and injury rates per reportable leak, applied to 700 miles.
3 Leak estimate is for any leak, including <50 bbl; approximate leak count for 50 bbl (reportable) = 2 in 50 years.
4 Pedernales watershed.