
Page 346 - Pipeline Risk Management Manual Ideas, Techniques, and Resources
P. 346
Case studies 14/323
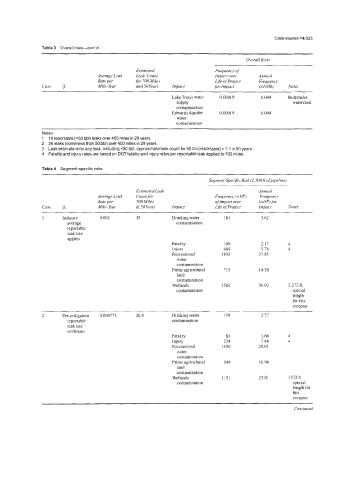
Table 3 Overall risks-cont'd
Overall Risky
Estimated Frequency of
Average Leak Leak Count Impact over Annual
Rate per for 700 Miles Life ofproject Frequency
Case d Mile-Year and SO Years Impact for Impact (XI 000) Notes
Lake Travis water 0.00019 0.004 Pedernales
supply watershed
contaminatlon
Edwards Aquifer 0.00019 0.004
water
contamination
Notes:
1 10 reportable (s50 bbl) leaks over450 miles in 29 years.
2 26 leaks (some less than 50 bbl) over 450 miles in 29 years.
3 Leak estimate is for any leak, including 60 bbl; approximate leak count for 50 bbl (reportable) = 1.1 in 50 years.
4 Fatality and injury rates are based on DOTfatality and injury rates per reportable leak applied to 700 miles.
Table 4 Segment-specific risks
Segment-Specific Risk (2, SOOP ofpipeline)
Estimated Leak Annual
Averuge Leak Countfor Frequency (~10') Frequencj.
Rate per 700 Miles oflmpact over (XI O'),fiir
Cuse if. .. Mile- Year- & SO Years Impact Life ofproject lmpact Notes
~~ ~ ~
1 Industry 0 001 35 Drinking water 181 3 62
average contamination
reportable
leak rate
applie5
Fatality 1 09 2.17 4
Injury 488 9.76 4
Recreational I893 37.85
water
contamination
Prime agricultural 715 14.30
land
contamination
Wetlands 1502 30.03 3.372 R,
contamination special
length
for this
receptor
2 Pre-mitigation 0.00077 I 26.8 Drinking water 139 2.77
reportable contamination
leak rate
continues
Fatality 83 1.66 4
Injury 3 74 7.48 4
Recreational 1450 29.01
water
contamination
Prime agricultural 548 10.96
land
contamination
Wetlands 1151 23.01 3312~
contamination special
length for
this
receptor
Continued