
Page 341 - Pipeline Risk Management Manual Ideas, Techniques, and Resources
P. 341
14/318Absolute Risk Estimates
impacts are those associated with the proposed project, transporting due to the uncertainties involved in such calculations, they are not the
refmedproductsfromHouston toEl Paso atamaximumrateof225,OOO primary basis oftbe EA findings.
barrels per day (bpd). Impact frequencies are calculated for several For the purposes oftbis report, “overall risk is defined as the risks
scenarios involving various combinations of leak frequencies, spill to receptors along the entire pipeline length over a period of 50 years.
sizes, and receptorvulnerabilities. Selected scenarios are also presented “Segment-specific risk” is defined as the risk to a point receptor that is
as leak probabilities. The calculations in this report offer some quantita- presented by 2,500 l? of the pipeline, over a period of 50 years. In this
tive support to the findings of the EA, but, due to the uncertainties usage. the pipeline segment-specific risk is essentially the overall risk
involved in such calculations, they are not the primary basis of the EA normalized to a length of 2,500 ft. Except in special circumstances, a
findings. point receptor is exposed to risks from leaks occurring along a maxi-
mum pipeline length of 2,500 A. The basis for this “impact zone” is
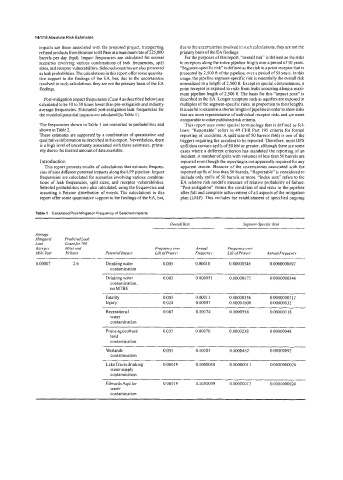
Post-mitigation impact frequencies (Case 4 as described below) are described in the EA. Longer receptors such as aquifers are exposed to
calculated to be 10 to 30 times lower than pre-mitigation and industry multiples of the segment-specific risks, in proportion to their lengths.
average frequencies. Estimated post-mitigation leak frequencies for It is useful to examine a shorter length of pipeline in order to show risks
the modeled potential impacts are tabulated [inTable I]. that are more representative of individual receptor risks and are more
comparable to other published risk criteria.
The frequencies shown in Table 1 are converted to probabilities and This report uses some special terminology that is defined as fol-
shown inTable 2. lows: “Reportable” refers to 49 CFR Part 195 criteria for formal
These estimates are supported by a combination of quantitative and reporting of accidents. A spill size of 50 barrels (bbl) is one of the
qualitative information as descnbed in this report. Nevertheless, there triggers requiring the accident to be reported. Therefore, most OPS
is a high level of uncertainty associated with these estimates, prima- spill data contain spills of 50 bbl or greater, although there a1.e some
rily due to the limited amount ofdata available. cases where a different criterion has mandated the reporting of an
incident. A number of spills with volumes of less than 50 barrels are
Introduction reported even though the reporting is not apparently required for any
This report presents results of calculations that estimate frequen- apparent reason. Because of the uncertainties associated with the
cies ofnine different potential ~mpacts along the LPPpipeline. Impact reported spills of less than 50 barrels, “Reportable” is considered to
frequencies are calculated for scenarios involving various combina- include only spills of 50 barrels or more. “Index sum” refers to the
tions of leak frequencies, spill sizes, and receptor vulnerabilities. EA relative risk model’s measure of relative probability of failure.
Selected probabilities were also calculated, using the frequencies and “Post-mitigation” means the condition of and risks to the pipeline
assuming a Poisson distribution of events. The calculations in this after full and complete achievement of all aspects of the mitigation
report offer some quantitative support to the findings of the EA, but, plan (LMP). This includes the establishment of specified ongoing
Table 1 Calculated Post-Mitigation Frequency of Selected Impacts
Overal/ Risk Segment-SpeciJic Risk
Average
Mitigated PredicredLeuk
Leak Countfor 700
Rateper Miies und Frequenq over Annual Frequency over
Mile- Year 50 Years Potenrial Jmpuct Lge of Project Frequency Li/e ofproject Annual Frequencv
0.00007 2.6 Drinking water 0.005 0.00010 0.00000346 0.0000000692
contamination
Drinking water 0.003 0.000051 0.00000173 0.0000000346
contamination,
no MTBE
Fatality 0.005 0.0001 1 0.00000356 0.0000000712
InJW 0.024 0.00047 0.00001600 0.00000032
Recreational 0.087 0.00174 0.0000588 0.000001 18
water
contamination
Pnme agricultural 0.035 0.00070 0.0000238 0.00000048
land
contamination
Wetlands 0.05 1 0.00 I01 0.0000462 0.00000092
contamination
Lake Travis drinking 0.00019 0.0000038 0.00000013 0.0000000026
water supply
contamination
Edwards Aquifer 0.00019 0.0000039 0.00000013 0.0000000026
water
contamination