
Page 336 - Pipeline Risk Management Manual Ideas, Techniques, and Resources
P. 336
Case studies 141313
pipeline name is XYZ and the ownerioperator company will be In this case, the Canadian Transportation Safety Board historical
called ACME. leak frequency is used to predict future performance of the subject
In this case, a relative risk assessment has been performed, pipeline.
but is to be supplemented by an evaluation of risks presented in Case 3. The subject pipeline is assumed to behave exactly like a hypo-
thetical, statistically “average” US. gas transmission pipeline. In
absolute terms. The introduction very briefly describes the this case, the U.S. historical leak frequency is used to predict future
purpose and scope of the analysis. performance ofthe subject pipeline.
Case 4. The subject pipeline is assumed to behave like some U.S.
This document presents preliminary estimates of risks to the public gas transmission pipelines; in particular, those with similar
that might be created by the proposed operation of the XYZ pipeline. diameter, age, stress level, burial depth, and integrity verifica-
The additional risk calculations build on the worst case estimates tion protocols. In this case, the U.S. historical leak frequency is
already provided in the regulatory application and will be used for used as a starting point to predict future performance of the
emergency response planning. This analysis is preliminary and subject pipeline.
requires verification and review before using in connection with
emergency pianning. In all cases, failures are as defined by the respective regulations
(“reportable accidents”) using regulatory criteria for reportable
A frequency of failures, fatalities, and injuries is estimated incidents.
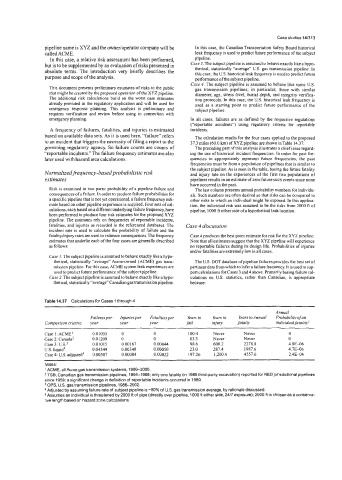
based on available data sets. As it is used here, “failure” refers The calculation results for the four cases applied to the proposed
to an incident that triggers the necessity of filing a report to the 37.3 miles(60.0 km)ofXYZpipelineareshowninTable 14.37:
governing regulatory agency. So failure counts are counts of The preceding part of this analysis illustrates a chief issue regard-
“reportable incidents.”The failure frequency estimates are also ing the use of historical incident frequencies. In order for past fre-
later used with hazard area calculations. quencies to appropriately represent future frequencies, the past
frequencies must be from a population of pipelines that is similar to
the subject pipeline. As is seen in the table, basing the future fatality
Normalized frequency-basedprobabilistic risk and injury rate on the experiences of the first two populations of
estimates pipelines results in an estimate of zero future such events since none
have occurred in the past.
Risk is examined in two parts: probability of a pipeline failure and The last column presents annual probability numbers for individu-
consequences of a failure. In order to produce failure probabilities for als. Such numbers are often desired so that risks can be compared to
a specific pipeline that is not yet operational, a failure frequency esti- other risks to which an individual might be exposed. In this applica-
mate based on other pipeline experience is required. Four sets of cal- tion, the individual risk was assumed to be the risks from 2000 ft of
culations, each based on a different underlying failure frequency, have pipeline, 1000 ft either side of a hypothetical leak location.
been performed to produce four risk estimates for the proposed XYZ
pipeline. The estimates rely on frequencies of reportable incidents,
fatalities, and injuries as recorded in the referenced databases. The Case 4 discussion
incident rate is used to calculate the probability of failure and the
fatalityiinjury rates are used to estimate consequences. The frequency Case 4 produces the best pomt estimate for risk for the XYZ pipeline.
estimates that underlie each of the four cases are generally described Note that all estimates suggest that the XYZ pipeline will experience
as follows: no reportable failures during its design life. Probabilities of injuries
andor fatalities are extremely low in all cases.
Case I. The subject pipeline is assumed to behave exactly like a hypo-
thetical, statistically “average” Acme-owned (ACME) gas trans- The US. DOT database of pipeline failures provides the best set of
mission pipeline. For this case, ACME system leak experiences are pertinent data from which to infer a failure frequency. It is used to sup-
used to predict future performance ofthe subject pipeline. port calculations for Cases 3 and 4 above. Primarily basing failure cal-
Case 2. The subject pipeline is assumed to behave exactly like a hypo- culations on US. statistics, rather than Canadian, is appropriate
thetical, statistically “average” Canadian gas transmission pipeline. because:
Table 14.37 Calculationsfor Cases 1 through 4
Annual
Failuresper Injuriesper Fatalitiesper Years to Years fo Years to Annual Probabilit?, ofan
Comparison criteria year year year fail injua fataliy individual fatali$
~ ~~ ~~
Case I: ACME’ 0.01055 0 0 100.4 Never Never 0
Case 2: Canada2 0.01200 0 0 83.3 Never Never 0
ca~e3:U.S.~ 0.01015 0.00167 0.00044 98.6 600.2 2278.8 4.8E-06
U.S. liquid3 0.04344 0.00348 0.00050 23.0 287.4 1987.6 4.7E-06
Case 4: US. adjusted4 0.00507 0.00084 0.00022 197.26 1,200.4 4557.6 2.4E-06
Notes:
’ ACME, all Acme gas transmission systems, 1986-2000.
* TSB, Canadian gas transmission pipelines, 1994-1998; only one fatality (in 1985 third-party excavation) reported for NEB jurisdictional pipelines
since 1959; a significant change in definition of reportable incidents occurred in 1989.
OPS, US. gas transmission pipelines, 19862002.
Adjusted by assuming failure rate of subject pipeline is -50% of U.S. gas transmission average, by rationale discussed.
Assumes an individual is threatened by 2000 fl of pipe (directly over pipeline, 1000 ft either side, 24i7 exposure); 2000 ft is chosen as a conserva-
tive length based on hazard zone calculations.