
Page 332 - Pipeline Risk Management Manual Ideas, Techniques, and Resources
P. 332
Hazard zone calculations 14/309
People located indoors at the time of failure would likely be flammable limit is often chosen for hydrocarbon gases. The use
afforded indefinite protection and of the lower flammability limit-the minimum concentration
People located outdoors at the time of failure would be of gas that will support combustion-is the most common
exposed to a finite but low chance of fatality [83]. cloud boundary. It conservatively represents the maximum dis-
tance from the leak site where ignition could occur. Sometimes
If 5000 Btu/hr-ft2 is used then the previous equation (for 112 of the LFL is used to allow for uneven mixing and the
methane) simplifies to: effects of random cloud movements. This lower concentration
creates a larger cloud. In the case of a toxic gas, the cloud
r=0.685 x JpXdZ boundary must be defined in terms of toxic concentrations.
where Note that unignited sour gas (hydrogen sulfide, H2S) releases
r = radius from pipe release point for given radiant heat inten- have been estimated to cause potential hazard zones 4 to 17
sity (feet) times greater than from an ignited release [95].
p = maximum pipeline pressure (psi) The extent and cohesiveness of a vapor cloud are critical
d = pipeline diameter (inches). parameters in determining possible threats from that cloud, as
is discussed in Chapter 7. Meteorological conditions have a
Note that thermal radiation intensity levels only imply dam- large influence on these parameters. In most dispersion mod-
age states. Actual damages are dependent on the quantity and eling, an atmospheric stability class is often assumed as part
types of receptors that are potentially exposed to these levels. of the model requirements. This can be based on analyses of
A preliminary assessment of structures has been performed, weather patterns in the area of interest or simply defaulted to
identifying the types of buildings and distances from the conservative (worst case) conditions. Often, an atmospheric
pipeline. class F-moderately stable-is chosen because it results in
larger cloud sizes compared to conditions involving more
Pool fire damages wind or sunlight effects. The information shown in Table
14.31 is often used in determining the atmospheric stability
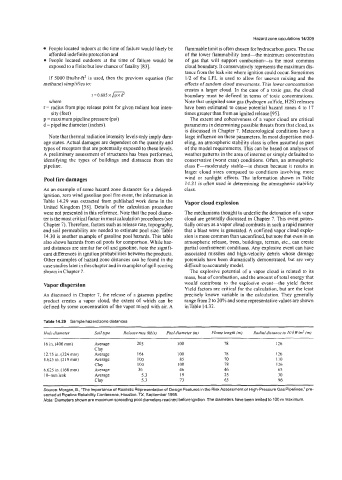
As an example of some hazard zone distances for a delayed- class.
ignition, zero wind gasoline pool fire event, the information in
Table 14.29 was extracted from published work done in the Vapor cloud explosion
United Kingdom [58]. Details of the calculation procedure
were not presented in this reference. Note that the pool diame- The mechanisms thought to underlie the detonation of a vapor
ter is the most critical factor in most calculation procedures (see cloud are generally discussed in Chapter 7. This event poten-
Chapter 7). Therefore, factors such as release rate, topography, tially occurs as a vapor cloud combusts in such a rapid manner
and soil permeability are needed to estimate pool size. Table that a blast wave is generated. A confined vapor cloud explo-
14.30 is another example of gasoline pool hazards. This table sion is more common than unconfined, but note that even in an
also shows hazards from oil pools for comparison. While haz- atmospheric release, trees, buildings, terrain, etc., can create
ard distances are similar for oil and gasoline, note the signifi- partial confinement conditions. Any explosive event can have
cant differences in ignition probabilities between the products. associated missiles and high-velocity debris whose damage
Other examples of hazard zone distances can be found in the potentials have been dramatically demonstrated but are very
case studies later in this chapter and in examples of spill scoring difficult to accurately model.
shown in Chapter 7. The explosive potential of a vapor cloud is related to its
mass, heat of combustion, and the amount of total energy that
Vapor dispersion would contribute to the explosive event-the yield factor.
Yield factors are critical for the calculation, but are the least
As discussed in Chapter 7, the release of a gaseous pipeline precisely known variable in the calculation. They generally
product creates a vapor cloud, the extent of which can be range from 2 to 20% and some representative values are shown
defined by some concentration of the vapor mixed with air. A inTable 14.32.
Table 14.29 Sample hazard zone distances
~~~
Hole diameter Soil type Release mte (kb/sj Pool diameter (m) Flame length (m) Radial distance to 10 k W/m2 (m)
16 in. (406 nun) Average 205 100 78 126
Clay
12.75 in.1324 mni) Average 164 100 78 I26
8.625 in. (219 mm) Average 100 85 70 110
Clay I00 100 78 I26
6.625 in. (168 mm) Average 30 46 46 65
1 O-mm leak Average 5.3 19 25 30
Clay 5.3 13 63 96
Source: Morgan, E., "The Importance of Realistic Representation of Design Features in the Risk Assessment of High-pressure Gas Pipelines," pre-
sented at Pipeline Reliability Conference, Houston, TX, September 1995.
Note: Diameters shown are maximum spreading pool diameters reached before ignition. The diameters have been limited to 100 m maximum.