
Page 329 - Pipeline Risk Management Manual Ideas, Techniques, and Resources
P. 329
14/306 Absolute Risk Estimates
Table 14.21 Indoor population densities Table 14.23 Typical population densities
Percent Hours People Designation Dwelling unitsper hectare
floor urea Areu per per week Per
Use occupied person (mz) occupation hectare High urban 30
Low urban 5
Residential 100 IO0 112 67 High rural I .67
Office 75 IO 50 223 Low rural 0.17
Retail 75 3 112 1667 Agricultural 0.03
(ground level)
Retail (other) 75 5 112 1000 Source: Jaques, S.. “NEB Risk Analysis Study, Development of Risk
Hotellmotel 75 15 84 250 Estimation Method,” National Energy Board of Canada report, April
School classroom 75 2 30 670 1992.
Note: Three persons per dwelling unit are assumed.
Table 14.22 Outdoor population densities
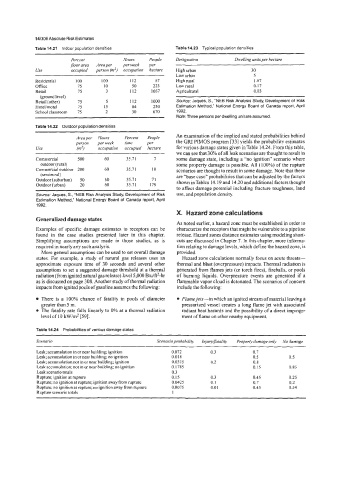
An examination of the implied and stated probabilities behind
Area per Hours Percent People
person perweek time per the GEU PIMOS program [33] yields the probability estimates
Use (mz) occupation occupied hectare for various damage states given in Table 14.24. From this table,
we can see that 30% of all leak scenarios are thought to result in
Commercial 500 60 35.71 7 some damage state, including a “no ignition” scenario where
outdoor (rural) some property damage is possible. All (100%) of the rupture
Commercial outdoor 200 60 35.71 I8 scenarios are thought to result in some damage. Note that these
(semirural) are “base case”probabi1ities that can be adjusted by the factors
Outdoor (suburban) 50 60 35.71 71 shown inTables 14.19 and 14.20 andadditional factors thought
Outdoor (urban) 20 60 35.71 179
to affect damage potential including fracture toughness, land
Source: Jaques, S.. “NEB Risk Analysis Study, Development of Risk use, and population density.
Estimation Method,” National Energy Board of Canada report, April
1992.
X. Hazard zone calculations
Generalized damage states
As noted earlier, a hazard zone must be established in order to
Examples of specific damage estimates to receptors can be characterize the receptors that might be vulnerable to a pipeline
found in the case studies presented later in this chapter. release. Hazard zones distance estimates using modeling short-
Simplifying assumptions are made in those studies, as is cuts are discussed in Chapter 7. In this chapter, more informa-
required in nearly any such analysis. tion relating to damage levels, which define the hazard zone, is
More general assumptions can be used to set overall damage provided.
states. For example, a study of natural gas releases uses an Hazard zone calculations normally focus on acute threats-
approximate exposure time of 30 seconds and several other thermal and blast (overpressure) impacts. Thermal radiation is
assumptions to set a suggested damage threshold at a thermal generated from flames jets (or torch fires), fireballs, or pools
radiation (from ignited natural gas release) level 5,000 Btu/f12-hr of burning liquids. Overpressure events are generated if a
as is discussed on page 308. Another study of thermal radiation flammable vapor cloud is detonated. The scenarios of concern
impacts from ignited pools of gasoline assumes the following: include the following:
There is a 100% chance of fatality in pools of diameter Flamejets-in which an ignited stream of material leaving a
greater than 5 m. pressurized vessel creates a long flame jet with associated
The fatality rate falls linearly to 0% at a thermal radiation radiant heat hazards and the possibility of a direct impinge-
level of 10 kW/m2 [59]. ment of flame on other nearby equipment.
Table 14.24 Probabilities of various damage states
Scenario Scenario pmbabilip Igiury/fatality Properg damage onb No damage
Leak; accumulation in or near building; ignition 0.072 0.3 0.7
Leak; accumulation in or near building; no ignition 0.018 0.5 0.5
Leak; accumulation not in or near building; ignition 0.03 15 0.2 0.8
Leak accumulation; not in or near building; no ignition 0.1785 0.15 0.85
Leak scenario totals 0.3
Rupture; ignition at rupture 0.15 0.3 0.45 0.25
Rupture; no ignition at rupture; ignition away from rupture 0.0425 0.1 0.7 0.2
Rupture; no ignition at rupture; no ignition away from rupture 0.8075 0.01 0.45 0.54
Rupture scenario totals 1