
Page 327 - Pipeline Risk Management Manual Ideas, Techniques, and Resources
P. 327
14/304Absolute Risk Estimates
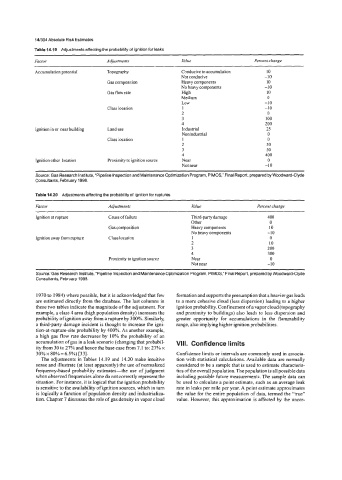
Table 14.19 Adjustments affecting the probability of ignition for leaks
Factor Adjustments Value Percent change
Accumulation potential Topography Conducive to accumulation 10
Not conducive -10
Gas composition Heavy components 10
No heavy components -10
Gas flow rate High 10
Medium 0
Low -10
Class location 1 -10
2 0
3 100
4 200
Ignition in or near building Land use Industrial 25
Nonindustrial 0
Class location 1 0
2 50
3 50
4 400
Ignition other location Proximity to ignition source Near 0
Not near -10
Source: Gas Research Institute, “Pipeline Inspection and Maintenance Optimization Program, PIMOS,” Final Report, prepared by Woodward-Clyde
Consultants, February 1998.
Table 14.20 Adjustments affecting the probability of ignition for ruptures
Factor Adjustments Value Percent change
Ignition at mpture Cause of failure Third-party damage 400
Other 0
Gas composition Heavy components 10
No heavy components -10
Ignition away from rupture Class location 1 0
2 10
3 200
4 300
Proximity to ignition source Near 0
Not near -10
Source: Gas Research Institute. “Pipeline Inspection and Maintenance Optimization Program, PIMOS,” Final Report, prepared by Woodward-Clyde
Consultants, February 1998
1970 to 1984) where possible, but it is acknowledged that few formation and supports the presumption that a heavier gas leads
are estimated directly from the database. The last columns in to a more cohesive cloud (less dispersion) leading to a higher
these two tables indicate the magnitude of the adjustment. For ignition probability. Confinement of a vapor cloud (topography
example, a class 4 area (high population density) increases the and proximity to buildings) also leads to less dispersion and
probability of ignition away from a rupture by 300%. Similarly, greater opportunity for accumulations in the flammability
a third-party damage incident is thought to increase the igni- range, also implying higher ignition probabilities.
tion-at-rupture-site probability by 400%. As another example,
a high gas flow rate decreases by 10% the probability of an
accumulation of gas in a leak scenario (changing that probabil- VIII. Confidence limits
ity from 30 to 27% and hence the base case from 7.1 to: 27% x
30% x 8O%= 6.5%) [33]. Confidence limits or intervals are commonly used in associa-
The adjustments in Tables 14.19 and 14.20 make intuitive tion with statistical calculations. Available data are normally
sense and illustrate (at least apparently) the use of normalized considered to be a sample that is used to estimate characteris-
frequency-based probability estimates-the use of judgment tics ofthe overall population. The population is all possible data
when observed frequencies alone do not correctly represent the including possible future measurements. The sample data can
situation. For instance, it is logical that the ignition probability be used to calculate a point estimate, such as an average leak
is sensitive to the availability of ignition sources, which in turn rate in leaks per mile per year. A point estimate approximates
is logically a function of population density and industrializa- the value for the entire population of data, termed the “true”
tion. Chapter 7 discusses the role of gas density in vapor cloud value. However, this approximation is affected by the uncer-