
Page 322 - Pipeline Risk Management Manual Ideas, Techniques, and Resources
P. 322
Index sums versus failure probability scores 14/299
a pipeline with no safety provisions, operated in the most failure rates, they are of less interest. The middle and end
hostile environment-consequently, failure is imminent. On regions are the most critical because that is where most real
the other end of the scale, is the hypothetical “bullet-proof” pipelines will operate.
pipeline-ane that is buried 20 ft deep, has a quadruple heavy
wall, is fracture resistant, uses corrosion-proof metal with sec-
ondary containment, has a fenced and guarded ROW 24 hours V. Index sums versus failure probability
with daily integrity verification, etc.-and has virtually no scores
chance of failure.
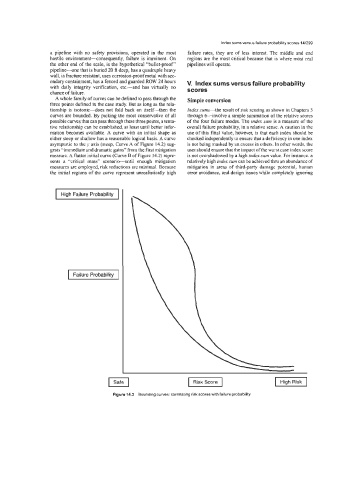
A whole family of curves can be defined to pass through the Simple conversion
three points defined in the case study. But as long as the rela-
tionship is isotonic-does not fold back on itself-ten the hdex sums-the result of risk scoring as shown in Chapters 3
curves are bounded. By picking the most conservative of all through &involve a simple summation of the relative scores
possible curves that can pass through these three points, a tenta- of the four failure modes. The index sum is a measure of the
tive relationship can be established at least until better infor- overall failure probability, in a relative sense. A caution in the
mation becomes available, A curve with an initial shape as use of this final value, however, is that each index should be
either steep or shallow has a reasonable logical basis. A curve checked independently to ensure that a deficiency in one index
asymptotic to the J’ axis (steep, Curve A of Figure 14.2) sug- is not being masked by an excess in others. In other words, the
gests “immediate and dramatic gains” from the first mitigation user should ensure that the impact of the worst case index score
measure. A flatter initial curve (Curve B of Figure 14.2) repre- is not overshadowed by a high index sum value. For instance, a
sents a “critical mass” scenarieuntil enough mitigation relatively high index sum can he achieved thru an abundance of
measures are employed risk reductions are minimal. Because mitigation in areas of third-party damage potential, human
the initial regions of the curve represent unrealistically high error avoidance, and design issues while completely ignoring
High Failure Probability
I Failure Probability I
Figure 14.2 Bounding curves’ correlating risk scores with failure probability