
Page 320 - Pipeline Risk Management Manual Ideas, Techniques, and Resources
P. 320
Failure rates 14/297
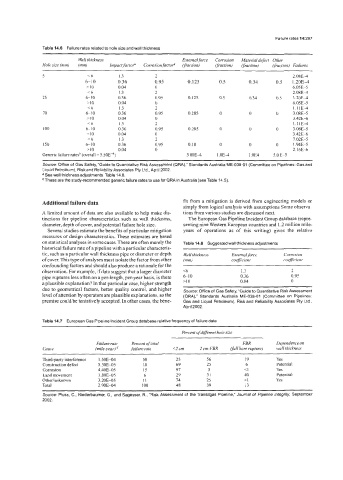
Table 14.6 Failure rates related to hole size and wall thickness
~ ~~~~
Wall thickness Externalforce Corrosion Material defect Other
Hole size (mm) (mm) Impuct facto? Corrosion factoP Ifraction) Ifraction) (fraction) (fraction) Failures
5 <6 I .3 2 2.08E4
6-10 0.36 0.95 0.125 0.5 0.34 0.5 1.20E4
>10 0.04 0 6.05E-5
<6 I .3 2 2.08E4
25 6-10 0.36 0.95 0.125 0.5 0.34 0.5 1.20E4
>I0 0.04 0 6.05E-5
<6 I .3 2 I.IIE4
70 610 0.36 0.95 0.285 0 0 0 3.08E-5
>I0 0.04 0 3.42E4
16 I .3 2 l.llE-4
IO0 6-10 0.36 0.95 0.285 0 0 0 3.088-5
>I0 0.04 0 3.42E-6
<6 1.3 2 7.02E-5
I50 6-10 0.36 0.95 0.18 0 0 0 1.94E-5
>I0 0.04 0 2.16E-h
Generic failure ratesb (overall = 5.50E") 3 00E-4 1 .0E4 1.0E4 5.0E-5
Source: Office of Gas Safety, "Guide to Quantitative Risk Assessment (QRA)." Standards Australia ME-038.01 (Committee on Pipelines: Gas and
Liquid Petroleum), Risk and Reliability Associates Pty Ltd.. April 2002.
a See wall thickness adjustments, Table 14.8.
These are the study-recommended generic failure rates to use for QRA in Australia (see Table 14.5).
Additional failure data fit from a mitigation is derived from engineering models or
simply from logical analysis with assumptions Some observa-
A limited amount of data are also available to help make dis- tions from various studies are discussed next.
tinctions for pipeline characteristics such as wall thickness, The European Gas Pipeline Incident Group database (repre-
diameter, depth of cover, and potential failure hole size. senting nine Western European countries and 1.2 million mile-
Several studies estimate the benefits of particular mitigation years of operations as of this writing) gives the relative
measures or design characteristics. These estimates are based
on statistical analyses in some cases. These are ofienmerely the Table 14.8 Suggested wall thickness adjustments
historical failure rate of a pipeline with a particular characteris-
tic, such as a particular wall thickness pipe or diameter or depth Wall thickness External force Corrosion
of cover. This type ofanalyses must isolate the factor from other (mml coejficient coefficient
confounding factors and should also produce a rationale for the
observation. For example, if data suggest that a larger diameter <6 1.3 2
pipe ruptures less often on a per-length, per-year basis, is there &IO 0.36 0.95
a plausible explanation? In that particular case, higher strength >10 0.04 0
due to geometrical factors, better quality control, and higher Source: Office of Gas Safety, "Guide to Quantitative Risk Assessment
level of attention by operators are plausible explanations, so the (QRA)," Standards Australia ME-038-01 (Committee on Pipelines:
premise could be tentatively accepted. In other cases, the bene- Gas and Liquid Petroleum), Risk and Reliability Associates Pty Ltd ,
ADril2002.
Table 14.7 European Gas Pipeline Incident Group database relative frequency of failure data
Percent ofdifferent hole size
Failure rate Percent of total FBR Dependence on
Case (mile-year)-' failure rufe <2 cm 2 em-FBR (jiull bore rupture) wall thickness
Third-party interference I .50E-04 50 25 56 19 Yes
Construction defect 5.30E-05 18 69 25 6 Potential
Corrosion 4.40E-05 15 97 3 <I Yes
Land movement 1.80E-05 6 29 31 40 Potential
Otheriunknown 3.20E-05 II 74 25 <I Yes
Total 2,90E+4 I00 4s 39 13
Source: Pluss, C., Niederbaumer, G., and Sagesser, R.. "Risk Assessment of the Transitgas Pipeline," Journal of Pipeline Integrity, September
2002.