
Page 319 - Pipeline Risk Management Manual Ideas, Techniques, and Resources
P. 319
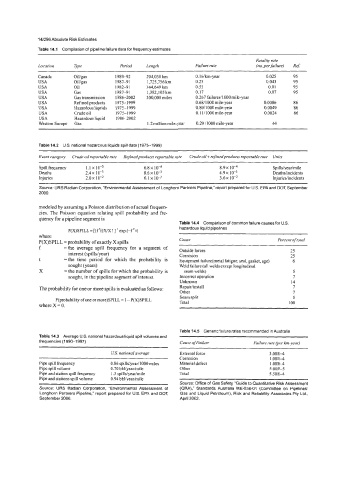
14/296Absolute Risk Estimates
            Table 14.1  Compilation of pipeline failure data for frequency estimates
                                                                               Fatality rate
            Location    Trpe          Period   Length        Failure rate      (no. perfailure)   Re$
             Canada    Oiligas      1989-92   294,030 km     0.16h-year           0.025    95
             USA       Oiligas      1987-91   1,725,156 km   0.25                 0.043    95
             USA       Oil          1982-91   344,649 km     0.55                  0.01    95
             USA       Gas          1987-9 1   1,382,105 !an   0.17                0.07    95
             USA        Gas transmission   1986-2002   300,000 miles   0.267 failures/lOOO mile-year
             USA        Refined products   1975-1999         0.6811000 mile-year   0.0086   86
             USA        Hazardous liquids   1975-1999        0.8911000 mile-year   0.0049   86
             USA        Crude oil   1975-1999                0.1 1ilOOOmile-year   0.0024   86
             USA        Hazardous liquid   1986-2002
             Western Europe   Gas             1.2 million mile-year   0.29 /lo00 mile-year   44


             Table 14.2  U.S. national hazardous liquids spill data (1975-1999)
             Event category   Crude oil reportable rate   Refinedproducts reportable rate   Crude oil + refinedproducts reportable rate  Units

             Spill frequency   1.1 x 10⁻³    6.8 x IO4              8.9~            Spillsiyearimile
                                                                       IO"
             Deaths        2.4 x 10⁻³        8.6 x lo-'             4.9 x 10⁻³      Deathsiincidents
             Injuries      2.0 x 10⁻²        6.1 x                  3.6~            Injuriesiincidents
             Source: URS Radian Corporation, "Environmental Assessment of Lonqhorn Partners Pipeline," report prepared for U.S. EPA and DOT, September
             2000.
             modeled by assuming a Poisson distribution of actual frequen-
             cies. The Poisson equation relating  spill probability  and fie-
             quency for a pipeline segment is
                                                        Table 14.4  Comparison of common failure causes for U.S.
                      P(X)SPILL  = [(f *t)X/X ! ] * exp (-f  * t)   hazardous liquid pipelines
             where                                                                        ~~
             P(X)SPILL =probability of exactly X spills   Cause                       Percent of total
             f      =the  average  spill  frequency  for  a  segment  of
                      interest (spills/year)            Outside forces                    25
                                                                                          25
                                                        Corrosion
             t      =the  time  period  for  which  the  probability  is   Equipment failure(meta1 fatigue, seal, gasket, age)   6
                      sought (years)                    Weld failure (all welds except longitudinal
             X      =the number of spills for which the probability is   seam welds)      5
                      sought, in the pipeline segment of interest.   Incorrect operation   7
                                                        Unknown                           14
             The probability for one or more spills is evaluated as follows:   Repairiinstall   7
                                                        Other                             I
                                                        Seam split                        5
                  P(prohahi1ity nfone 0rmore)SPILL = 1 - P(X)SPILL
             where X = 0.                               Total                            100

                                                        Tabla 14.5  Generic failure rates recommended in Australia
             Table 14.3  Average US. national hazardous liquid spill volumes and
             frequencies (1990-1997)                    Cause ofFailure       Failure rate per h-year)
                                   US. national average   External force           3.00E-4
                                                        Corrosion                  1 .DOE4
             Pipe spill frequency   0.86 spillsiyearl1000 miles   Material defect   1.00E-4
             Pipe spill volume     0.70 hhl/year/mile   Other                      5.OOE-5
             Pipe and station spill frequency   1.3 spillsiyearlmile   Total       5.50E4
             Pipe and stations spill volume   0.94 bhllyearimile
                                                        Source: Office of Gas Safety, "Guide  to Quantitative Risk Assessment
             Source:  URS  Radian Corporation, "Environmental Assessment of   (ORA)," Standards Australia  ME-038-01  (Committee on  Pipelines:
             Longhorn Partners Pipeline." report prepared for U.S. EPA and DOT,   Gas and Liquid Petroleum), Risk and Reliability Associates Pty Ltd..
             September 2000.                            April 2002.