
Page 318 - Pipeline Risk Management Manual Ideas, Techniques, and Resources
P. 318
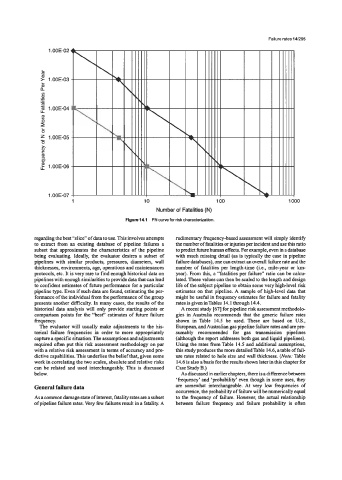
Failure rates 14/295
                 .00E-02


                 .00E-03


                 .00E-04


                 .00E-05


                 .00E-06


                 .00E-07
                       1                     10                                          1( 30
                                                 Number of Fatalities (N)
                                       Flgure 14.1  FN curve for riskcharacterization.


            regarding the best “slice” of data to use. This involves attempts   rudimentary frequency-based assessment will simply identify
            to extract from an  existing database of  pipeline failures a   the number of fatalities  or injuries per incident and use this ratio
            subset that approximates the characteristics of the pipeline   to predict future human effects. For example, even in a database
            being evaluating.  Ideally, the  evaluator desires a  subset of   with much missing detail (as is typically the case in pipeline
            pipelines with  similar products, pressures, diameters, wall   failure databases), one can extract an overall failure rate and the
            thicknesses, environments, age, operations and maintenances   number of  fatalities per length-time (i.e.,  mile-year or km-
            protocols, etc. It is very rare to fiid enough historical data on   year). From this, a “fatalities per failure” ratio can be calcu-
            pipelines with enough similarities to provide data that can lead   lated. These values can then be scaled  to the length and design
            to confident estimates of future performance for a particular   life of the subject pipeline to obtain some very high-level risk
            pipeline type. Even if such data are found, estimating the per-   estimates on that pipeline. A sample of high-level data that
            formance of the individual from the performance of the group   might be useful in frequency estimates for failure and fatality
            presents another difficulty. In many cases, the results of the   rates is given inTables 14.1 through 14.4.
            historical data analysis will only provide starting points or   A recent study [67] for pipeline risk assessment methodolo-
            comparison points for the “best” estimates of future failure   gies in Australia recommends that the generic  failure rates
            frequency.                                 shown  in  Table  14.5  be  used.  These  are based  on  U.S.,
             The evaluator will usually make adjustments to the his-   European, and Australian gas pipeline failure rates and are pre-
            torical  failure  frequencies in  order to more  appropriately   sumably  recommended  for  gas  transmission  pipelines
            capture a specific situation. The assumptions and adjustments   (although the report addresses both gas and liquid pipelines).
            required often put this risk assessment methodology on par   Using the rates from Table 14.5 and additional assumptions,
            with a relative risk assessment in terms of accuracy and pre-   this study produces the more detailedTable 14.6, a table of fail-
            dictive capabilities.  This underlies the belief that, given some   ure rates related to hole size and wall thickness. (Note: Table
            work in correlating the two scales, absolute and relative risks   14.6 is also a basis for the results shown later in this chapter for
            can be related and used interchangeably. This is discussed   Case Study B.)
            below.                                      As discussed in earlier chapters, there is a difference between
                                                       ‘frequency’ and ‘probability’ even though in some uses, they
            General failure data                       are  somewhat interchangeable. At  very  low  frequencies  of
                                                       occurrence, the probability of failure will be numerically equal
            As a common damage state of interest, fatality rates are a subset   to the frequency of failure. However, the actual relationship
            of pipeline failure rates. Very few failures result in a fatality. A   between  failure  frequency  and  failure probability is  often