
Page 321 - Pipeline Risk Management Manual Ideas, Techniques, and Resources
P. 321
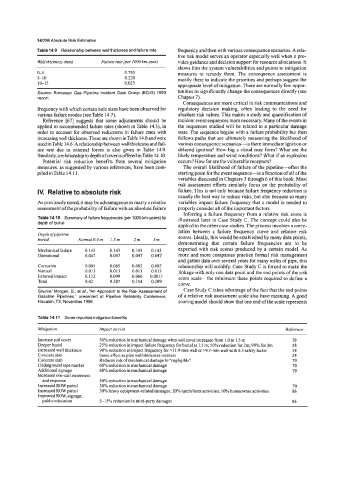
14/298Absolute Risk Estimates
            Table 14.9  Relationship between wall thickness and failure rate   frequency and then with various consequence scenarios.  A rela-
                                                       tive risk model serves an operator especially well when it pro-
             Wall thickness (mm)   Failure rate (jer IO00 km-year)   vides guidance and decision support for resource allocations. It
                                                       shows him the system vulnerabilities and points to mitigation
            0-5                        0.750           measures to  remedy them. The  consequence assessment is
            5-1 0                      0.220           mostly there to indicate the priorities and perhaps suggest the
             10-15                     0.025
                                                       appropriate level of mitigation. There are normally few oppor-
            Source:  European  Gas Pipeline  Incident  Data  Group  (EGIG) 1993   tunities to significantly change the consequences directly (see
            report.                                    Chapter 7).
                                                         Consequences are more critical in risk communications and
            frequency with which certain hole sizes have been observed for   regulatory  decision  making,  often  leading to  the  need  for
            various failure modes (seeTable 14.7).     absolute risk values. This makes a study and quantification of
              Reference  [67] suggests  that  some  adjustments  should  be   incident event sequences more necessary. Many ofthe events in
            applied to recommended failure rates (shown in Table  14.5), in   the  sequences studied will be related to a particular damage
            order to account for observed reductions in failure rates with   state. The sequence begins with a failure probability but then
            increasing wall thickness. These are shown in Table 14.8 and were   follows paths that are ultimately measuring the likelihood of
            used in Table 14.6.  A relationship between wall thickness and fail-   various consequence scenarios-is  there immediate ignition or
            ure  rate  due  to  external  forces  is  also given  in Table  14.9.   delayed  ignition? How big a cloud may form? What are the
            Similarly, a relationship to depth of cover is offered inTable 14.10.   likely temperature and wind conditions? What if an explosion
              Potential  risk  reduction  benefits  from  several  mitigation   occurs? How far are the vulnerable receptors?
            measures, as suggested by various references, have been com-   The overall likelihood of failure of the pipeline-ofien  the
            piledinTable 14.11.                        starting point for the event sequence-is   a hction of all of the
                                                       variables discussed in Chapters 3 through 6 of this book. Most
                                                       risk assessment efforts similarly focus on the probability of
             IV.  Relative to absolute risk            failure. This is not only because failure frequency reduction is
                                                       usually the best way to reduce risks, but also because so many
            As previously noted, it may be advantageous to marry a relative   variables  impact failure frequency that a model is needed to
            assessment of the probability of failure with an absolute failure   properly consider all of the important factors.
                                                         Inferring a failure frequency from a relative risk score is
             Table 14.10  Summary of  failure frequencies (per 1000 km-years) by   illustrated later in Case Study C. The concept could also be
             depth of  burial
                                                       applied to the other case studies. The process involves a corre-
                                                        lation  between  a  failure  frequency  curve  and  relative  risk
             Depth ofpipeline
             burial      Normal0.9m   1.5m   2m   3m    scores. Ideally, this would be established by many data points,
                                                       demonstrating  that  certain  failure  frequencies  are  to  be
             Mechanical failure   0.143   0.143   0.143   0.143   expected with risk scores produced by  a certain model. As
             Operational   0.047   0.047   0.047   0.047   more and more companies practice formal risk management
                                                        and gather data over several years for many miles of pipe, this
             Corrosion     0.085   0.085   0.085   0.085   relationship will solidify. Case Study C is forced to make the
             Natural       0.013   0.013   0.013   0.013   linkage with only one data point and the end points of the risk
             External impact   0.132   0.099   0.066   0.0013   score scale-the  minimum three points required to define a
             Total         0.42    0.387   0.354   0.289
                                                       curve.
             Source: Morgan, B., et ai., “An Approach to the Risk Assessment of   Case Study C takes advantage of the fact that the end points
             Gasoline  Pipelines,” presented at  Pipeline  Reliability  Conference,   of a relative risk assessment scale also have meaning. A good
             Houston, TX. November 1996.                scoring model should show that one end of the scale represents
             Table 14.1 I  Some reported mitigation benefits
            Mitigation         Impact on risk                                           Reference
             Increase soil cover   56% reduction in mechanical damage when soil cover increased from 1 .O to 1.5 m   70
             Deeper burial     25% reduction in impact failure frequency for burial at 1.5 m; 50% reduction for 2m; 99% for 3m   58
             Increased wall thickness   90% reduction in impact frequency for > I 1.9-mm wall or >9.1 -mm wall with 0.3 safety factor   58
             Concrete slab     Same effect as pipe wall thickness increase                58
             Concrete slab     Reduces  risk of mechanical damage to “negligible”         70
             Underground tape marker   60% reduction in mechanical damage                 70
             Additional signage   40% reduction in mechanical damage                      70
             Increased one-call awareness
              and response     50% reduction in mechanical damage
             Increased ROW patrol   30% reduction in mechanical damage                    70
             Increased ROW patrol   30% heavy equipment-related damages; 20% rancWfann activities; 10% homeowner activities   86
             Improved ROW, signage,
              public education   5-15%  reduction in third-party damages                  86