
Page 325 - Pipeline Risk Management Manual Ideas, Techniques, and Resources
P. 325
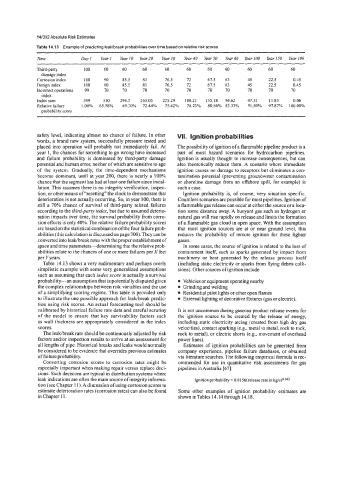
14/302Absolute Risk Estimates
            Table 14.13  Example of predicting leaklbreak probabilities overtime based on relative risk scores

            Time          Day 1   Year1   Year IO   Year20   Year30   Year40   Years0   Year60  Year 100   Year150   Year 199
            Third-party    100   60   60     60    60     60     60   60     60    60     60
              damage index
            Corrosion index   100   90   85.5   81   76.5   72   67.5   63   45    22.5    0.45
            Design index   100   90   85.5   81    76.5   72     67.5   63   45    22.5    0.45
            Incorrect operations   99   70   70   70   70   70   70   70     70    70     70
              index
            Index sum      399   310   294.5   265.05   225.29   180.23   135.18   94.62   47.31   11.83   0.06
            Relative failure   1.00%  65.98%   69.30%  72.44%   75.42%   78.23%   80.86%  83.33%   91.50%   97.87%  100.00%
              probability score


            safety level, indicating almost no chance of failure. In other   VII.  Ignition probabilities
            words, a brand new system, successfully pressure tested and
            placed into operation will probably  not  immediately fail. At   The possibility of ignition of a flammable pipeline product is a
            year 1, the chances for something to go wrong have increased   part  of  most  hazard  scenarios  for  hydrocarbon  pipelines.
            and  failure probability is dominated by  third-party damage   Ignition is usually thought to increase consequences, but can
            potential and human error, neither ofwhich are sensitive to age   also theoretically reduce them. A scenario where immediate
            of  the  system.  Gradually,  the  time-dependent mechanisms   ignition causes no damage to receptors but eliminates a con-
            become  dominant, until at year 200, there is nearly  a  100%   tamination potential (preventing groundwater contamination
            chance that the segment has had at least one failure since instal-   or shoreline damage from  an offshore spill, for example) is
            lation. This assumes there is no integrity verification, inspec-   such a case.
            tion, or other means of “resetting” the clock to demonstrate that   Ignition probability is,  of course, very  situation specific.
            deterioration is not actually occurring. So, in year 100, there is   Countless scenarios are possible for most pipelines. Ignition of
            still a 70% chance of survival of third-party related failures   a flammable gas release can occur at either the source or a loca-
            according to the third-par@ index, but due to assumed deterio-   tion some distance away. A buoyant gas such as hydrogen or
            ration impacts over time, the survival probability from corro-   natural gas will rise rapidly on release and limits the formation
            sion effects is only 40%. The relative failure probability scores   of a flammable gas cloud in open space. With the assumption
            are based on the statistical combination of the four failure prob-   that most ignition sources are  at or  near ground level,  this
            abilities (this calculation is discussed on page 300). They can be   reduces the probability of remote  ignition for  these lighter
            converted into leakibreak rates with the proper establishment of   gases.
            space and time parameters-determining  that the relative prob-   In some cases, the source of ignition is related to the loss of
            abilities relate to the chances of one or more failures perXfeet   containment itself, such as sparks generated by  impact from
            per Yyears.                                machinery  or  heat  generated  by  the  release  process  itself
              Table 14.13 shows a very rudimentary and perhaps overly   (including static electricity or sparks from flying debris colli-
            simplistic example with some very generalized assumptions   sions). Other sources of ignition include
            such as assuming that each index score is actually a survival
            probability-an  assumption that is potentially disputed given   Vehicles or equipment operating nearby
            the complex relationships between risk variables and the use   Grinding and welding
            of a simplifying scoring regime. This table is provided only   Residential pilot lights or other open flames
            to illustrate the one possible approach for leaWbreak predic-   External lighting or decorative fixtures (gas or electric).
            tion using risk scores. An actual forecasting tool should be
            calibrated by historical failure rate data and careful scrutiny   It is not uncommon during gaseous product release events for
            of the model  to ensure that  key  survivability  factors  such   the  ignition source to  be  created by  the  release of energy,
            as wall thickness are appropriately  considered  in the index   including static electricity arcing (created from high dry gas
            scores.                                    velocities), contact sparking (e.g., metal to metal, rock to rock,
              The leakibreak rate should be continuously adjusted by risk   rock to metal), or electric shorts (e.g.,  movement of overhead
            factors andor inspection results to arrive at an assessment for   power lines).
            all lengths of pipe. Historical breaks and leaks would normally   Estimates of ignition probabilities can be generated from
            be considered to be evidence that overrides previous estimates   company  experience, pipeline failure databases, or obtained
            of failure probability.                    via literature searches. The following empirical formula is rec-
              Converting corrosion  scores to  corrosion  rates  might  be   ommended for use  in  quantitative risk  assessments for gas
            especially important when making repair versus replace deci-   pipelines in Australia [67]:
            sions. Such decisions are typical in distribution systems where
            leak indications are often the main source of integrity informa-   Ignition probability = 0.01 56(release rate in kgis)o.”2
            tion (see Chapter l l). A discussion ofusing corrosion scores to
            estimate deterioration rates (corrosion rates) can also be found   Some  other  examples of  ignition probability  estimates are
            in Chapter 1 1.                            showninTables 14.14 through 14.18.