
Page 333 - Pipeline Risk Management Manual Ideas, Techniques, and Resources
P. 333
14/310 Absolute Risk Estimates
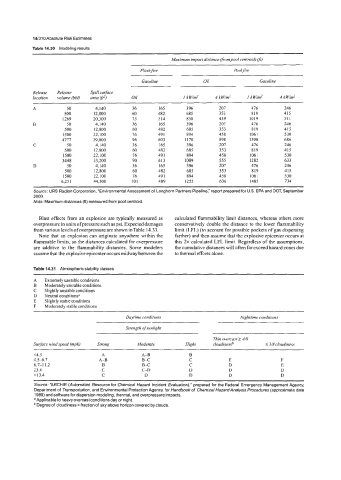
Table 14.30 Modeling results
Maximum impact distance fmm pool centroid) Ift,,
Flash fire Poolfire
Gasoline Oil Gasoline
Release Release Spillsurface
location volume (bbl) area fiz) Oil I kW/mz 4 kW/m2 I kW/mz 4 kW/m'
A 50 4,140 36 165 396 207 476 246
500 12,800 60 482 685 353 819 415
1269 20,300 73 514 858 439 1019 51 1
B 50 4,140 36 165 396 207 476 246
500 12,800 60 482 685 353 819 415
1500 22,100 76 49 1 894 458 1061 530
4777 39,000 96 603 1178 598 1390 686
C 50 4,140 36 165 396 207 476 246
500 12,800 60 482 685 353 819 415
1500 22,100 76 49 1 894 458 1061 530
3448 33,200 90 613 1089 555 1282 633
D 50 4,140 36 I65 396 207 476 246
500 12,800 60 482 685 353 819 415
1500 22,100 76 491 894 458 1061 530
6,25 1 44,500 101 489 1255 636 1485 734
Source: URS Radian Corporation, "Environmental Assessment of Longhorn Partners Pipeline," report prepared for U.S. EPA and DOT, September
2000.
Note: Maximum distances (ft) measured from pool centroid.
Blast effects from an explosion are typically measured as calculated flammability limit distances, whereas others more
overpressure in units ofpressure such as psi. Expected damages conservatively double the distance to the lower flammability
from various levels of overpressure are shown in Table 14.33. limit (LFL) (to account for possible pockets of gas dispersing
Note that an explosion can originate anywhere within the farther) and then assume that the explosive epicenter occurs at
flammable limits, so the distances calculated for overpressure this 2x calculated LFL limit. Regardless of the assumptions,
are additive to the flammability distances. Some modelers the cumulative distances will often far exceed hazard zones due
assume that the explosive epicenter occurs midway between the to thermal effects alone.
Table 14.31 Atmospheric stability classes
A Extremely unstable conditions
B Moderately unstable conditions
C Slightly unstable conditions
D Neutral conditionsa
E Slightly stable conditions
F Moderately stable conditions
Daytime conditions Nighttime conditions
Strength ofsunlight
Thin overcast 2 4/8
Suface windspeed (mph) Strong Moderate Slight cloudinessb 5 3/8 cloudiness
<4.5 A A-B E
4.54.7 A-E B-C C E F
6.7-1 1.2 B Rc C D E
23.4 C C-D D D D
213.4 C D D D D
Source: "ARCHIE (Automated Resource for Chemical Hazard lncident Evaluation)," prepared for the Federal Emergency Management Agency,
Department of Transportation, and Environmental Protection Agency, for Handbook of Chemical Hazard Analysis Procedures (approximate date
1989) and software for dispersion modeling, thermal, and overpressure impacts.
aApplicable to heavy overcast conditions day or night.
Degree of cloudiness = fraction of sky above horizon covered by clouds.