
Page 339 - Pipeline Risk Management Manual Ideas, Techniques, and Resources
P. 339
14316 Absolute Risk Estimates
Table 14.41 Nine failure scenario results
~ ~~~~~
Impact distances @) effected by
specified Btu/hr-f$ thermal
intensity Probability
Damage Damage Damage Individual
state Pressure Hale Pressure Ignition state over state if experiencing a
scenario Hole (in.) @si& 12,000 5000 4000 1600 (?A) (?A) (?A) project failure (?A) damagestad
1 16 1800 300ft 465ft 520ft 822ft 20 70 40 3.23E-04 31 7.65E-06
2 8 1800 150 232 260 411 40 70 20 3.23E-04 31 1.53E-05
3 16 2220 333 516 578 913 20 20 40 9.24E-05 9 2.19E-06
4 8 2220 167 258 289 457 40 20 20 9.24E-05 9 4.37E-06
5 0.5 1800 9 15 16 26 40 70 5 8.08E-05 8 1.53E-05
6 16 1500 274 424 475 751 20 10 40 4.62E-05 4 1.09E-06
7 8 1500 137 212 237 375 40 10 20 4.62E-05 4 2.19E-06
8 0.5 2220 10 16 18 29 40 20 5 2.31E-05 2 4.37E-06
9 0.5 1500 9 13 15 23 40 10 5 1.15E-05 1 2.19E-06
1.04E-03 100
~~
Notes:
Failure rate used is 0.0005failures per mile-year as calculated in Case 4 of the normalized, frequency-based probabilistic calculations.
* Probabilities of one or more damage states over the life of the project is 1.04E-03.
This calculation uses failure frequency for 2000 R of pipe and assumes an individual is directly over the pipeline continuously (24/7) and therefore
continuously exposed to the potential damage states for 40 years.
received unprecedented attention due to several factors, Appendix F and Chapter 7 also contain information from this
including the very environmentally sensitive areas that EA [86] and have been referenced in the following excerpt.
would be crossed, the age of the existing portions, and
economic/competitive issues related to the intended product
transport. Executive Summary
The ‘‘LW refers to a document specifying mitigation This report presents estimated impact frequencies and probabilities of
measures to be taken to reduce risks. nine different potential impacts along the LPP pipeline. The potential
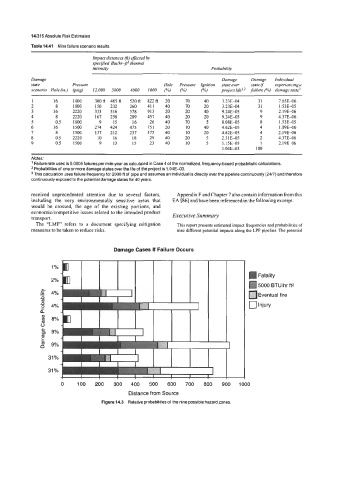
Damage Cases If Failure Occurs
1 %
Fatality
2%
5000 BTU/hr ft2
E 4% Eventual fire
E
m
n 0 Injury
g 4%
a
3 8%
0
8 9%
m
2 9%
31 %
31 %
0 100 200 300 400 500 600 700 800 900 1000
Distance from Source
Figure 14.3 Relative probabilities of the nine possible hazard zones.