
Page 349 - Pipeline Risk Management Manual Ideas, Techniques, and Resources
P. 349
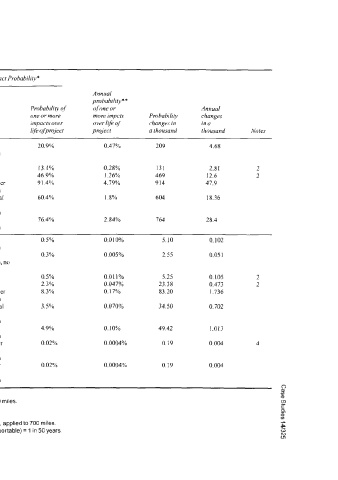
Table 5  Overall Impact Probabilities for Cases 3 and 4
 Overall Impact Probabilifv*
 ~~
 Estimated           Annual
 leak                probability**
 count for   Probability of   ofone or       Annual
 Average leak   700 miles   one or more   more impcts   Probabilifv   changes
 rateper   and   impacts over   over life qf   changes in   in a
 Case   f.   mile-year   50 yeam   Impact   lfe  ifproject   project   a thousand   thousand   Notes
 3   Pre-mitigation   0.001991   69.1   Drinking water   20.9%   0.47%   209   4.68
 leak rate   contamination
 estimate
 Fatality   13.1%       0.28%      131        2.81       2
 Injury   46.9%         1.26%      469        12.6       2
 Recreational water   91.4%   4.79%   914     47.9
 contamination
 Prime agricultural   60.4%   1.8%   604      18.36
 land
 contamination
 Wetlands   76.4%       2.84%      764        28.4
 contamination
 4   Post-mitigation   0.000073   2.6   Drinking water   0.5%   0.010%   5.10   0.1 02
 leak rate   contamination
 estimate   Drinking water   0.3%   0.005%   2.55   0.051
 contamination, no
 MTBE
 Fatality   0.5%        0.01 1%     5.25      0.105      2
 Injury   2.3%          0.047%     23.38      0.473      2
 Recreational water   8.3%   0.17%   83.20    1.736
 contamination
 Prime agricultural   3.5%   0.070%   34.50   0.702
 land
 contamination
 Wetlands   4.9%        0.10%      49.42      1.013
 contamination
 LakeTravis water   0.02%   0.0004%   0.19    0.004      4
 supply
 contamination
 Edwards Aquifer   0.02%   0.0004%   0.19     0.004
 water
 contamination
 'Overall impact probability is probability of one or more events in 50 years over 700 miles.
 "Overall impact probability, annual, is probability of one or more events in 1 year over 700 miles.
 Notes:
 1  26 leaks (some less than 50 bbl) over450 miles in 29 years.
 2  Fatality and injury rates are based on DOTfatality and injury rates per reportable leak, applied to 700 miles.
 3  Leak estimate is for any leak, including <50 bbl; approximate leak count for 50 bbl (reportable) = 1 in 50 years.
 4  Pedernales watershed.