
Page 347 - Pipeline Risk Management Manual Ideas, Techniques, and Resources
P. 347
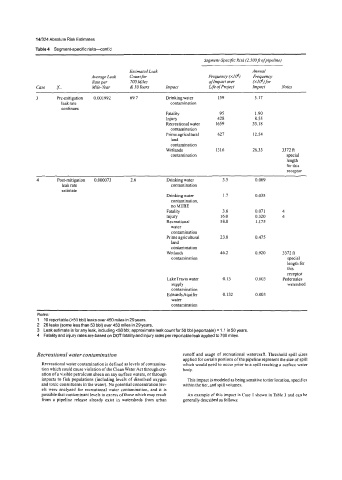
14/324 Absolute Risk Estimates
            Table 4  Segment-specific risks-cont'd
                                                               Segment-Specific Risk (2SOOfi ofpipeline)
                                        Estimated Leak                        Annual
                             Average Leak   Countfor            Frequency (XI@)   Frequency
                             Rate per   700 Miles               of Impact over   (x106)f.r
            Case   $..       Mile-Year   & SO Years   Impact    Life ofProject   Impact   Notes
            3     Pre-mitigation   0.001992   69.1   Drinking water   159     3.17
                   leak rate                         contamination
                   continues
                                                   Fatality         95        1.90
                                                   Injury          428        8.55
                                                   Recreational water   1659   33.18
                                                     contamination
                                                   Prime agricultural   627   12.54
                                                     land
                                                     contamination
                                                   Wetlands       1316        26.33    3312 ft
                                                     contamination                      special
                                                                                        length
                                                                                        for this
                                                                                        receptor
            4     Post-mitigation   0.000073   2.6   Drinking water   3.5     0.069
                    leak rate                        contamination
                   estimate
                                                   Drinking water    1.7      0.035
                                                     contamination,
                                                     no MTBE
                                                   Fatality          3.6      0.071    4
                                                   Injw             16.0      0.320    4
                                                   Recreational     58.8       1.175
                                                     water
                                                     contamination
                                                    Prime agricultural   23.8   0.475
                                                     land
                                                     contamination
                                                   Wetlands         46.2       0.920   3372 ft
                                                     contamination                      special
                                                                                        length for
                                                                                        this
                                                                                        receptor
                                                   Lake Travis water   0.13    0.003   Pedemales
                                                     supply                             watershed
                                                     contamination
                                                    Edwards Aquifer   0.132    0.003
                                                     water
                                                     contamination
            Notes:
            1  10 reportable (~50 bbl) leaks over450 miles in 29 years.
            2  26 leaks (some less than 50 bbl) over450 miles in 29 years.
            3  Leak estimate is for any leak, including 60 bbl; approximate leak count for 50 bbl (reportable) = 1.1 in 50 years.
            4  Fatality and injury rates are based on DOTfatality and injury rates per reportable leak applied to 700 miles.


            Recreational water contamination            runoff and usage  of recreational watercraft. Threshold spill sizes
                                                        applied for certain portions of the pipeline represent the size of spill
             Recreational water contamination is defined as levels of contamina-   which would need to occur prior to a spill reaching a surface water
             tion which could cause violation ofthe Clean Water Act through cre-   body.
             ation of a visible pewoleurn sheen on any surface waters, or through
             impacts to fish populations (including levels of dissolved oxygen   This impact is modeled as being sensitive to tier location, specifics
             and toxic constituents in the water). No potential concentration lev-   within the tier, and spill volumes.
             els were  analyzed for recreational water  contamination, and it  is
             possible that contaminant levels in excess of those which may result   An example of this impact is Case I  shown in Table 3 and can he
             from  a  pipeline release already  exist  in  watersheds from  urban   generally described as follows: