
Page 359 - Pipeline Risk Management Manual Ideas, Techniques, and Resources
P. 359
15/334 Risk Management
probability of failure and generally exposes more receptors to pipelines in the state. Of course, the localized benefit to
consequences. receptors near to Hwy 1-244 is dramatic.
Projects such as ILI, public education, ROW maintenance,
and patrol can impact many miles of pipe and hence often have
a large impact on CR. V. Acceptable risk
Changes over time Adjectives are often added to the word risk when discussing
how much risk we “should” be exposed to. Examples include
Note that the CR can also demonstrate the natural risk increase
over time. The risk model measures the relative risk at all points Acceptable risk levels
along a pipeline, at a specific point in time. The risk numbers Tolerable risk levels
are therefore a snapshot. They represent all conditions and Justifiable risk levels
activities at the time of the snapshot. If inspections and mainte- Negligible risks
nance are not done, the CR degrades. The most meaningful Trivial risks.
measure of changes in the risk situation will be how the risk
score for the length of interest changes over time. So, changes There do not seem to be any universally accepted definitions
in risk are easily tracked by comparing risk snapshots. This can of these phrases, with many being used interchangeably.
be done for a specific point on a pipeline, an entire pipeline, or Acceptable risk is seen more often in regulatory decision mak-
any stretch of any pipeline. It can also be done for any set of ing and sometimes implies a negligible risk. On the other hand,
pipelines, such as “all pipelines in Texas,” “all propane lines,” to tolerate a risk does not necessarily mean it is regarded as
“all mainlines,” “all lines older than 20 years,” and so on. negligible. Tolerability seems to refer to a willingness to live
The cumulative risk calculation also remedies the difficul- with a risk in order to secure certain benefits and perhaps in
ties possibly encountered in tracking risk changes when the confidence that the risk is being properly controlled. Risk
segment boundaries change after every assessment. The CR tolerance/acceptability/justification is a complex topic with
can be calculated for any length of pipe, regardless of segment social and psychological implications. This book uses the term
boundaries. acceptable risk with the understanding that it includes implica-
tions of the other terms.
Cumulative risk example In general, society decides what is an acceptable level of risk
for any particular endeavor. That level changes depending on
As an example of the use of a CR calculation, Line ABC in the activity. What is acceptable for highway traffic deaths is
Alabama at Hwy 1-244 has a CR value of about 20. If a pro- generally not acceptable for pipeline accident deaths, for
posed 100-ft line replacement occurs, risk will be reduced. The instance. Many social and economic considerations are thought
CR value for that location will be improved about 400% from to influence the human risk tolerance. These are beyond the
20 to 80. scope of this text. A main principle, however, is that risk reduc-
A11 of Line ABC in Alabama has a CR of about I1 7.5. The tion is a cost to society. Society weighs the costs of improved
1-244 project improves about 100 ft of Line ABC in Alabama safety in a specific situation against alternate expenditures.
and improves the overall risks of Line ABC Alabama (as meas- Do we spend an extra dollar to spare one traffic fatality every
ured by CR) by about 3%. As is expected, a project can have a 10 years? Or do we spend that dollar to feed a hungry child for
very dramatic impact on the local risk. Its impact is lessened 2 days? These types of value judgments help determine the
from a broader view. acceptable risk.
If an employee training and public education program is Most determinations of acceptable risk level are made in
expanded and enhanced, the expected benefit will apply to all comparison with other risks. Unless a risk is very high, it is usu-
pipelines in Alabama. These efforts would change the CR score ally not interpreted as a standalone value. It may also be exam-
forAlabama from 11 7.5 to 107.5, an improvement ofabout 8%. ined with regard to how much risk it adds to an individual’s
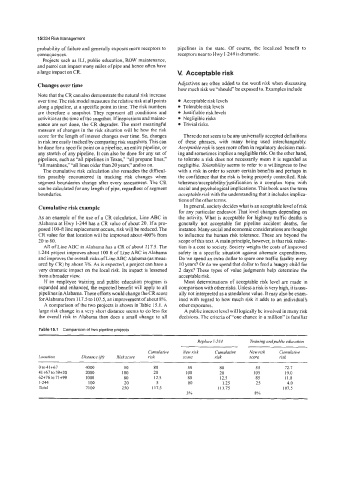
A comparison of the two projects is shown in Table 15.1. A other exposures.
large risk change in a very short distance seems to do less for A public interest level will logically be involved in many risk
the overall risk in Alabama than does a small change to all decisions. The criteria of “one chance in a million” is familiar
Table 15.1 Comparison of two pipeline projects
~~-
Replace 1-244 Training andpublic education
Curnulafive Nm risk Cumulative New risk Cumulative
Location Distance ft) Riskscore risk score risk score risk
Oto41+67 4000 50 80 50 80 55 72.7
41+67 to 59+20 2000 100 20 100 20 105 19.0
62+76 to71+99 1000 80 12.5 80 12.5 85 11.8
1-244 100 20 5 80 1.25 25 4.0
Total 7100 250 117.5 113.75 107.5
3% 8%