
Page 52 - Pipeline Risk Management Manual Ideas, Techniques, and Resources
P. 52
Designing a risk assessment model 2/31
Experts believe that there is no effect of age on the micro- rating tasks.) It is therefore useful for capturing expert judg-
crystalline structure of steel such that the strength and ductility ments. However, these advantages are at least partially offset by
properties of steel pipe are degraded over time. The primary inferior measurement quality, especially regarding obtaining
metal-related phenomena are the potential for corrosion and consistency.
development of cracks from fatigue stresses. In the cases of cer- Some emerging techniques for artificial intelligence systems
tain other materials, mechanisms of strength degradation might seek to make better use of human reasoning to solve problems
be present and should be included in the assessment, Examples involving incomplete knowledge and the use of descriptive
include creep and UV degradation possibilities in certain plas- terms. In mirroring human decision making. fuzzy logic inter-
tics and concrete deterioration when exposed to certain chemi- prets and makes use of natural language in ways similar to our
cal environments. In some situations, a slow-acting earth risk models.
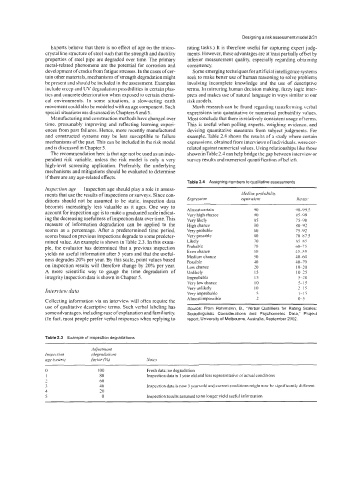
movement could also be modeled with an age component. Such Much research can be found regarding transforming verbal
special situations are discussed in Chapters 4 and 5. expressions into quantitative or numerical probability values.
Manufacturing and construction methods have changed over Most conclude that there is relatively consistent usage of terms.
time. presumably improving and reflecting learning experi- This is useful when polling experts, weighing evidence. and
ences from past failures. Hence, more recently manufactured devising quantitative measures from subject judgments. For
and constructed systems may be less susceptible to failure example. Table 2.4 shows the results of a study where certain
mechanisms of the past. This can be included in the risk model expressions, obtained from interviews of individuals, were cor-
and is discussed in Chapter 5. related against numerical values. Using relationships like those
The recommendation here is that age not be used as an inde- shown in Table 2.4 can help bridge the gap between interview or
pendent risk variable. unless the risk model is only a very survey results and numerical quantification of beliefs.
high-level screening application. Preferably, the underlying
mechanisms and mitigations should be evaluated to determine
ifthere are any age-related effects.
Table 2.4 Assigning numbers to qualitative assessments
Inspecfion age Inspection age should play a role in assess-
ments that use the results of inspections or surveys. Since con- Median prohahilrw
ditions should not be assumed to be static, inspection data E-rpression equl~'ulellr Ruii,yt
becomes increasingly less valuable as it ages. One way to
account for inspection age is to make a graduated scale indicat- Almost certain YO 9&99 5
85-')9
90
Very high chance
ing the decreasing usefulness of inspection data over time. This Very likely 85 75-90
measure of information degradation can be applied to the High chance 80 x0 Y?
scores as a percentage. After a predetermined time period Very probable 80 75-92
scores based on previous inspections degrade to some predeter- Very possible RO 70 87.5
mined value. An example is shown in Table 2.3. In this exam- Likely 70 65 85
ple, the evaluator has determined that a previous inspection Probable 70 h&75
yields no useful information after 5 years and that the useful- Even chance 50 45-55
40-6(1
Medium chance
50
ness degrades 20% per year. By this scale, point values based Possible 40 40-70
on inspection results will therefore change by 20% per year. Low chance 70 I &70
A more scientific way to gauge the time degradation of Unlikely 15 IO 3
integrity inspection data is shown in Chapter 5. Improbable 15 5-?0
Very low chance 10 5-15
Very unlikely 10 2 I
Inteniew dutu Very improbable 5 1-15
Collecting information via an interview will often require the Almost impossible 2 0-5
use of qualitative descriptive terms. Such verbal labeling has Source: From Rohrmann, 6.. "Verbal Qualifiers for Ratlng Scales:
some advantages, including ease of explanation and familiarity. Sociolinguistic Considerations and Psychometric Data," Project
(In fact. most people prefer verbal responses when replying to report, University of Melbourne, Australia, September 2002
Table 2.3 Example of inspection degradations
Adjustment
Inspection (degradation)
age (j'ear.YJ fuctor /%i Nota
IO0 Fresh data; no degradation
80 Inspection data is 1 year old and less representative ofactual conditions
60
40 Inspection data is now 3 years old and current conditions might now be significantly di tErent
20
0 Inspection results assumed to no longer yield useful information